
2024美国癌症统计报告解读及中美癌症流行情况对比
作者简介:
赵文静(2001-),女,硕士在读,主要从事胃癌流行病学研究,ORCID: 0009-0001-6691-680X
 李文庆: 研究员、博导,北京大学肿瘤医院临床流行病学研究中心副主任。入选中组部国家千人计划青年项目、北京市海外高层次人才、北京市特聘专家、北京市优青拔尖个人、北京市登峰人才团队负责人。北京大学博士,哈佛医学院博士后,美国国立癌症研究所访问研究员,归国前任美国常青藤名校布朗大学助理教授。研究方向为肿瘤流行病学和分子流行病学。已发表SCI收录论文130余篇,代表性论文发表于BMJ、JCO、JAMA Intern Med等高水平杂志。曾获中国肿瘤青年科学家奖、美国国立卫生院中国学者联谊会Distinguished Scientist Award、Richard B. Salomon教师研究奖、美国皮肤基金会学术生涯进展奖、美国癌症研究协会Aflac奖等。入选中国科协十大代表,中国抗癌协会理事及首届青年理事会副理事长、北京抗癌协会青年理事会副理事长兼秘书长、中国营养学会营养与组学技术分会副主委、中国抗癌协会癌症筛查与早诊早治专委会常委兼秘书长、肿瘤流行病学专业委员会常委、中国健康促进与教育协会肿瘤筛查和预防专委会常委、中华预防医学会流行病学分会委员等
。
李文庆: 研究员、博导,北京大学肿瘤医院临床流行病学研究中心副主任。入选中组部国家千人计划青年项目、北京市海外高层次人才、北京市特聘专家、北京市优青拔尖个人、北京市登峰人才团队负责人。北京大学博士,哈佛医学院博士后,美国国立癌症研究所访问研究员,归国前任美国常青藤名校布朗大学助理教授。研究方向为肿瘤流行病学和分子流行病学。已发表SCI收录论文130余篇,代表性论文发表于BMJ、JCO、JAMA Intern Med等高水平杂志。曾获中国肿瘤青年科学家奖、美国国立卫生院中国学者联谊会Distinguished Scientist Award、Richard B. Salomon教师研究奖、美国皮肤基金会学术生涯进展奖、美国癌症研究协会Aflac奖等。入选中国科协十大代表,中国抗癌协会理事及首届青年理事会副理事长、北京抗癌协会青年理事会副理事长兼秘书长、中国营养学会营养与组学技术分会副主委、中国抗癌协会癌症筛查与早诊早治专委会常委兼秘书长、肿瘤流行病学专业委员会常委、中国健康促进与教育协会肿瘤筛查和预防专委会常委、中华预防医学会流行病学分会委员等
。
通讯作者:
Interpretation on Cancer Statistics, 2024 and Comparison of Cancer Prevalence Between China and America
-
摘要:
2024年1月,《2024美国癌症统计报告》在CA:A Cancer Journal for Clinicians杂志发布,该报告预测了2024年美国癌症发病以及死亡情况,并全面概述了美国癌症的长期流行趋势。本文对该报告进行了详细总结,并结合中国最新癌症负担数据对中美癌症流行情况进行对比,综合分析了中、美两国癌症流行现状及其可能成因,以期为中国癌症防控策略制定提供参考。
Abstract:In January 2024, Cancer Statistics, 2024 was published in CA: A Cancer Journal for Clinicians. This report estimated cancer cases and deaths in 2024 and described the secular trends of major cancers over recent decades. We summarized the report and integrated the latest data on the cancer burden in China to compare the prevalence cancer between two countries. We also comprehensively interpreted the underlying reasons for these trends to provide insights for cancer prevention and control strategies in China.
-
0 引言
结直肠癌是全球第三大最常见的恶性肿瘤,也是癌症相关死亡的第二大原因[1],给卫生保健系统带来了沉重的负担。结直肠息肉是正常结直肠黏膜表面的突出物,组织学上可分为腺瘤性和非腺瘤性息肉,而“正常黏膜-腺瘤-癌”路径被认为是结直肠癌的主要演变过程,涉及组织细胞内驱动突变的逐渐累积,最终发生癌变[2-3]。结直肠腺瘤性息肉进展为结直肠癌的发病率和死亡率显著增加,因此,通过结肠镜检查对腺瘤性息肉进行早期筛查并行内镜下切除可有效降低结直肠癌的发生风险。中老年人围手术期并发症发生率及死亡率增加,术后恢复期长,对生活质量影响大[3-4],在早期发现和早期治疗结直肠腺瘤性息肉方面需更为重视。本文以我院就诊的中老年结直肠息肉患者为研究对象,评估不同病理类型息肉的临床和内镜特征,分析社会人口学、生活饮食习惯、临床病史、内镜特点等指标对腺瘤性息肉的影响,最终确定结直肠腺瘤性息肉的危险因素,以对高危人群进行充分的监测,为提高结直肠癌的早期筛查及诊疗水平提供依据。
1 资料与方法
1.1 研究人群
数据来源于2023年4月至2024年6月在首都医科大学附属北京友谊医院消化内镜中心行结肠镜检查及内镜下治疗的中老年患者,对以上患者进行相关问卷调查、实验室和结肠镜检查及息肉病理数据收集。本研究已经本院伦理委员会审核批准(2022-P2-401-01),所有患者均签署知情同意书。纳入标准:(1)年龄>45岁;(2)均自愿行结肠镜检查,且经病理检查确诊;(3)临床资料均完整无缺项。排除标准:(1)既往行下消化道外科手术;(2)妊娠患者;(3)正在参加其他临床研究,会影响本研究的搜集指标者。
1.2 数据收集
结肠镜检查前患者配合医生认真完成调查问卷的填写,内容包括患者姓名、年龄、性别、生活饮食习惯、慢性病史、简易精神状态评价量表(Mini-mental state examination, MMSE)等。身高和体重在内镜检查前规范测量,体重指数(Body mass index, BMI)由体重(kg)除以身高(m)的平方得出。高血压由患者自我报告的高血压病史确定。甘油三酯、血糖等空腹血液生化指标由医院检验科分析得出。益生菌是指食品中的活的有益微生物,包括双歧杆菌、乳杆菌、酪酸梭菌、布拉酵母菌、肠球菌、地衣芽孢杆菌和蜡样芽孢杆菌等。
所有患者均由经验丰富的消化内科医生使用电子结肠镜进行检查。患者在检查前一天分次口服聚乙二醇电解质散溶液以行肠道准备,检查时协助患者保持左侧卧位、双膝屈曲。结肠镜检查时准确记录息肉的数量、部位、形态、大小等信息,镜下取活检或根据患者实际情况选择合理治疗方案切除息肉,包括圈套器摘除、内镜下黏膜切除术、内镜黏膜下剥离术等。将息肉组织标本进行合理固定后送往病理科行病理检查,由经验丰富的病理科医生进行诊断。根据病理特点,炎性息肉、增生性息肉被定义为非腺瘤性息肉,而锯齿状腺瘤、管状腺瘤、管状绒毛状腺瘤、绒毛状腺瘤被定义为腺瘤性息肉。
1.3 统计学方法
数据采用R软件(4.2.2版)进行分析。正态分布的连续变量用均值和标准差表示,非正态分布的连续变量用中位数和四分位间距表示,计数资料数据用数量和百分比表示。多独立样本的组间比较时,分类变量采用卡方检验,正态分布的连续变量需采用方差分析,非正态分布的连续变量需采用Kruskal-Wallis检验。通过单因素及多因素Logistic回归分析对年龄、性别、BMI、生活饮食习惯、实验室数据、结肠镜病理检查结果等因素计算比值比(Odds ratio, OR)和95%CI。双侧P<0.05表示差异有统计学意义。
2 结果
2.1 结直肠息肉临床病理特征分析
共有1 527例45岁以上的结直肠息肉患者被纳入分析。经病理确诊,其中炎性息肉264例(17.3%),增生性息肉262例(17.2%),锯齿状腺瘤39例(2.6%),管状腺瘤926例(60.6%),管状绒毛状腺瘤33例(2.2%),绒毛状腺瘤3例(0.2%)。各病理分组下的临床和病理特征见表1,其中年龄、BMI、吸烟史、饮酒史、益生菌服用习惯、MMSE评分、息肉部位、息肉形态、息肉长径在各组间的差异均有统计学意义(均P<0.05)。
表 1 不同病理类型的结直肠息肉患者的基线特征Table 1 Baseline characteristics of patients with colorectal polyps of different pathological typesTotal Inflammatory
polypsHyperplastic
polypsSerrated
adenomasTubular
adenomasTubular villous
adenomasVillous
adenomasP Number 1 527 264 262 39 926 33 3 Gender(n(%)) 0.141 Male 826(54.1) 127(48.1) 142(54.2) 24(61.5) 518(55.9) 14(42.4) 1(33.3) Female 701(45.9) 137(51.9) 120(45.8) 15(38.5) 408(44.1) 19(57.6) 2(66.7) Age, mean(SD) 69.85(5.23) 69.29(4.49) 69.28(5.65) 69.44(4.45) 70.15(5.35) 71.03(4.58) 71.00(0.00) 0.047 BMI, mean(SD)(kg/m2) 24.44(3.34) 24.19(3.41) 24.33(3.06) 23.54(3.05) 24.68(3.38) 21.87(2.61) 24.03(1.86) <0.001 Smoking history(n(%)) 0.001 No 1117 (73.1)217(82.2) 202(77.1) 28(71.8) 643(69.4) 25(75.8) 2(66.7) Yes 410(26.9) 47(17.8) 60(22.9) 11(28.2) 283(30.6) 8(24.2) 1(33.3) Drinking history(n(%)) <0.001 No 1086 (71.1)216(81.8) 195(74.4) 29(74.4) 621(67.1) 23(69.7) 2(66.7) Yes 441(28.9) 48(18.2) 67(25.6) 10(25.6) 305(32.9) 10(30.3) 1(33.3) Hypertension(n(%)) 0.277 No 797(52.2) 143(54.2) 152(58.0) 19(48.7) 466(50.3) 15(45.5) 2(66.7) Yes 730(47.8) 121(45.8) 110(42.0) 20(51.3) 460(49.7) 18(54.5) 1(33.3) Triglyceride, mean(SD)
(mmol/L)1.44(0.76) 1.47(0.78) 1.47(0.79) 1.31(0.67) 1.44(0.75) 1.24(0.59) 1.69(0.40) 0.469 Fasting blood glucose,
mean(SD)(mmol/L)5.67(1.33) 5.64(1.46) 5.85(1.19) 6.01(1.50) 5.62(1.31) 5.47(1.43) 5.66(0.16) 0.081 Eat cereal(n(%)) 0.835 ≥4 times per week 572(37.5) 95(36.0) 96(36.6) 17(43.6) 350(37.8) 12(36.4) 2(66.7) <4 times per week 955(62.5) 169(64.0) 166(63.4) 22(56.4) 576(62.2) 21(63.6) 1(33.3) Eat fresh vegetables (n(%)) 0.686 ≥4 times per week 1412 (92.5)250(94.7) 240(91.6) 35(89.7) 853(92.1) 31(93.9) 3(100.0) <4 times per week 115(7.5) 14(5.3) 22(8.4) 4(10.3) 73(7.9) 2(6.1) 0(0.0) Eat fresh fruits(n(%)) 0.72 ≥4 times per week 1223 (80.1)213(80.7) 215(82.1) 32(82.1) 736(79.5) 24(72.7) 3(100.0) <4 times per week 304(19.9) 51(19.3) 47(17.9) 7(17.9) 190(20.5) 9(27.3) 0(0.0) Eat probiotics(n(%)) 0.027 ≥4 times per week 1363 (89.3)242(91.7) 223(85.1) 36(92.3) 834(90.1) 26(78.8) 2(66.7) <4 times per week 164(10.7) 22(8.3) 39(14.9) 3(7.7) 92(9.9) 7(21.2) 1(33.3) MMSE score, mean(SD) 28.76(2.21) 28.96(1.60) 28.99(1.61) 28.33(2.04) 28.70(2.38) 27.67(4.45) 28.00(1.00) 0.008 Polyp location(n(%)) <0.001 Ileocecal region 98(6.4) 21(8.0) 11(4.2) 7(17.9) 55(5.9) 3(9.1) 1(33.3) Ascending colon 279(18.3) 52(19.7) 29(11.1) 12(30.8) 179(19.3) 7(21.2) 0(0.0) Transverse colon 429(28.1) 62(23.5) 50(19.1) 9(23.1) 301(32.5) 7(21.2) 0(0.0) Descending colon 214(14.0) 39(14.8) 26(9.9) 5(12.8) 141(15.2) 3(9.1) 0(0.0) Sigmoid colon 321(21.0) 46(17.4) 91(34.7) 2(5.1) 172(18.6) 9(27.3) 1(33.3) Rectum 186(12.2) 44(16.7) 55(21.0) 4(10.3) 78(8.4) 4(12.1) 1(33.3) Polyp shape(n(%)) <0.001 Pedicled polyp 141(9.2) 20(7.6) 19(7.3) 2(5.1) 91(9.8) 9(27.3) 0(0.0) Sessile polyp 544(35.6) 59(22.3) 77(29.4) 16(41.0) 377(40.7) 14(42.4) 1(33.3) Flat polyp 790(51.7) 173(65.5) 162(61.8) 13(33.3) 433(46.8) 7(21.2) 2(66.7) Laterally
developmental polyp52(3.4) 12(4.5) 4(1.5) 8(20.5) 25(2.7) 3(9.1) 0(0.0) Polyp diameter,
mean(SD)(mm)7.54(6.80) 7.25(8.44) 5.24(2.68) 12.49(10.47) 7.87(6.41) 13.43(11.41) 4.67(2.89) <0.001 2.2 腺瘤性息肉的危险因素分析
在Logistic回归模型中,性别、年龄、BMI、吸烟史、饮酒史、高血压史、空腹甘油三酯水平、空腹血糖水平、饮食习惯、MMSE评分、息肉的病理特点均纳入分析范围。单变量回归分析显示,年龄更大、吸烟史、饮酒史、高血压病史及息肉长径是腺瘤性息肉的危险因素,而高MMSE评分(更良好的认知水平)、息肉部位为直肠及息肉形态为平坦型为保护性因素。经多变量模型调整后,结果显示:年龄更大(OR: 1.024,95%CI: 1.001~1.048,P=0.044)、BMI水平更高(OR: 1.046,95%CI: 1.008~1.087,P=0.020)和有吸烟史(OR: 1.493,95%CI: 1.035~2.158,P=0.032)的患者的结直肠息肉为腺瘤的风险显著升高,而高MMSE评分所代表的具有更好认知功能的患者结直肠息肉为非腺瘤性的可能性更大(OR: 0.929,95% CI: 0.871~0.984,P=0.017)。在息肉病理特征方面,病变部位在直肠(OR: 0.396,95%CI: 0.229~0.677,P=0.001)、平坦型(OR: 0.531,95%CI: 0.342~0.810,P=0.004)或侧向发育型(OR: 0.306,95%CI: 0.135~0.698,P=0.005)的息肉更多为非腺瘤性息肉,随着息肉大小的增加,病理为腺瘤性息肉的可能性显著增加(OR: 1.063,95%CI: 1.035~1.095,P<0.001),见表2。
表 2 腺瘤组和非腺瘤组单因素和多因素Logistic回归分析Table 2 Univariate and multivariate logistic regression analyses of adenoma and non-adenoma groupsVariables Univariable model Multivariable model OR 95%CI P OR 95%CI P Gander (Female) 0.834 0.675-1.031 0.094 1.168 0.892-1.530 0.258 Age 1.032 1.011-1.053 0.002 1.024 1.001-1.048 0.044 BMI 1.026 0.994-1.060 0.118 1.046 1.008-1.087 0.020 Smoking history 1.700 1.325-2.193 <0.001 1.493 1.035-2.158 0.032 Drinking history 1.726 1.354-2.212 <0.001 1.264 0.881-1.815 0.204 Hypertension 1.269 1.027-1.570 0.028 0.896 0.700-1.145 0.379 Triglyceride (mmol/L) 0.929 0.811-1.067 0.294 0.875 0.746-1.028 0.101 Fasting blood glucose (mmol/L) 0.936 0.866-1.012 0.096 0.944 0.867-1.029 0.182 Eat cereal (<4 times per week) 0.928 0.745-1.154 0.502 0.888 0.695-1.132 0.339 Eat fresh vegetables (<4 times per week) 1.166 0.781-1.774 0.461 1.653 1.003-2.769 0.052 Eat fresh fruits (<4 times per week) 1.132 0.868-1.483 0.365 0.887 0.634-1.245 0.485 Eat probiotics (<4 times per week) 0.874 0.627-1.229 0.433 0.800 0.555-1.160 0.234 MMSE score 0.922 0.865-0.975 0.008 0.929 0.871-0.984 0.017 Polyp location (Ascending colon) 1.185 0.717-1.935 0.501 1.216 0.721-2.027 0.457 Polyp location (Transverse colon) 1.372 0.847-2.191 0.191 1.368 0.828-2.231 0.214 Polyp location (Descending colon) 1.111 0.661-1.849 0.686 1.194 0.693-2.039 0.518 Polyp location (Sigmoid colon) 0.651 0.401-1.042 0.078 0.686 0.412-1.126 0.141 Polyp location (Rectum) 0.426 0.253-0.706 0.001 0.396 0.229-0.677 0.001 Polyp shape (Sessile polyp) 1.147 0.750-1.729 0.519 1.141 0.725-1.772 0.562 Polyp shape (Flat polyp) 0.519 0.346-0.765 0.001 0.531 0.342-0.810 0.004 Polyp shape (Laterally spreading polyp) 0.860 0.434-1.753 0.671 0.306 0.135-0.698 0.005 Polyp diameter 1.063 1.040-1.090 <0.001 1.063 1.035-1.095 <0.001 3 讨论
结直肠癌是世界发病率和死亡率最高的消化系统恶性肿瘤[1],腺瘤性息肉被认为是大多数结直肠癌的前驱病变[5],早期识别腺瘤性息肉并行内镜下治疗是预防结直肠癌的重要措施。本研究分析了中老年结直肠腺瘤性和非腺瘤性息肉患者的人口统计学、生活习惯、临床病史、实验室检查、内镜特征等信息。结果表明,年龄更大、体重指数更高、吸烟、息肉大小是腺瘤性息肉的独立危险因素,而患者认知功能更好、病变部位在直肠和平坦型或侧向发育型形态的息肉病理更可能为非腺瘤性。
本研究未发现腺瘤与非腺瘤患者间的性别差异。年龄是结直肠腺瘤发生的重要危险因素,结直肠息肉和结直肠癌的发病率一般随年龄增长而增加[6]。对无症状人群进行的结肠镜筛查研究表明,50岁人群的腺瘤患病率为25%~30%[7]。尸检研究发现,70岁人群的这一比例高达50%[8],而20多岁或30岁人群的这一比例只有1%~4%[9]。结肠镜检查是检测结直肠息肉和结直肠癌最有效的方式,基于多项研究结果,美国癌症协会指南建议根据患者的偏好从45岁开始进行结肠镜筛查,以早期发现结直肠癌和结直肠腺瘤息肉[10]。因此,我们将研究人群的年龄限制在45岁及以上的中老年人,结果表明,与先前的结果一致,年龄越大的结直肠息肉患者越容易发生腺瘤的病理改变。
既往多项研究报道,肥胖与结直肠腺瘤的发生和复发密切相关[11-12],而减重可以有效降低腺瘤发生风险[13]。本研究结果也表明,代表超重和肥胖的高BMI水平会增加腺瘤发生的风险。这其中的机制尚不明确,可能与肥胖伴随的胰岛素抵抗通过胰岛素和胰岛素样生长因子轴导致有丝分裂和抗凋亡信号转导异常相关。此外,肥胖也反映了一种慢性低度炎性反应状态,从而增加息肉癌变的风险[14]。
吸烟是导致结直肠癌的公认的主要风险因素。此前多项研究发现,吸烟与腺瘤性息肉以及晚期肿瘤如浸润性结直肠癌之间存在密切关联[12],这与我们的研究结果类似。每日吸烟数量、吸烟时间与结直肠息肉的风险存在剂量-反应关系[15]。烟草中含有多种致癌物质,先前的研究揭示了一些吸烟与结直肠腺瘤发生的潜在机制,如相关基因的甲基化减少[16]、致癌物代谢酶的基因变异[17]、DNA修复基因EXO1和ATM的多态性[18]、错配修复酶的突变[19]、XPC的多态性[20]等。一项荟萃分析表示,酒精与结直肠腺瘤的风险增加有关,这种关联似乎在欧洲的研究中更为显著[21]。本研究并没有显示酒精对结直肠腺瘤发生的影响,这可能与不同地区研究人群的基因和生活方式差异相关。
本研究结果表明,MMSE代表的认知功能状态与是否为腺瘤性息肉有显著相关性,而因果关系尚不明确,既往暂无分析认知功能与结直肠腺瘤发生的相关性研究。但已有多项研究表示,结直肠癌、炎性反应性肠病等与认知功能和精神疾病有密切关联,微生物群-肠-脑轴可能在其中起重要作用,肠道微生物群组成失调和肠道屏障功能异常可能参与了重要的病理机制[22]。这一点,未来还需要大样本量的随机对照试验来证实。
除人群特征外,息肉特征也会影响腺瘤发生的风险。既往有多项研究报道息肉的大小为结直肠息肉恶性肿瘤的独立预测因子[23-24]。直径为1厘米的腺瘤发生腺癌的风险为1%,直径为1~2厘米的腺瘤为10%,而直径大于2厘米的腺瘤发生腺癌的风险为50%[25]。本研究结果表明,息肉大小也为腺瘤病理的独立危险因素。因此,对于直径较大的息肉更应警惕,尽早行内镜下切除以避免发生癌变。本研究中,息肉为平坦型和侧向发育型时较带蒂息肉病理为腺瘤的风险更低,发展为结直肠癌的可能性更小,这与既往的研究结果一致[26]。但近年来,有学者认为扁平息肉可能通过特殊的机制发生进展期肿瘤性病变[27],因此扁平状息肉的潜在恶变可能也需警惕。本研究结果提示位于直肠的息肉多为非腺瘤性息肉。既往研究认为右半结肠腺瘤发生率更高,结直肠癌的发生位置也逐渐向右侧转移[28],这可能与肠内容物在右半结肠中停留时间较长,使致癌物质和炎性反应介质长时间刺激而发展成腺瘤性息肉相关[29-30],但本研究未发现腺瘤性息肉在结肠各节段发生率的差异。
本研究也存在一些局限性。首先,研究是单中心横断面研究,样本量有限,纳入分析的变量不够全面,可能会遗漏重要的指标。其次,患者的吸烟史、饮酒史、饮食习惯和高血压病史等数据来自自我报告的问卷调查,可能会造成回忆偏倚,从而对结果产生潜在影响。
Competing interests: The authors declare that they have no competing interests.利益冲突声明:所有作者均声明不存在利益冲突。作者贡献:赵文静:研究设计与实施、论文构思与撰写尹周一、李文庆:研究设计指导、文章审阅及修改王裕新:文章审阅及修改 -
![]()
![]()
![]()
![]()
![]()
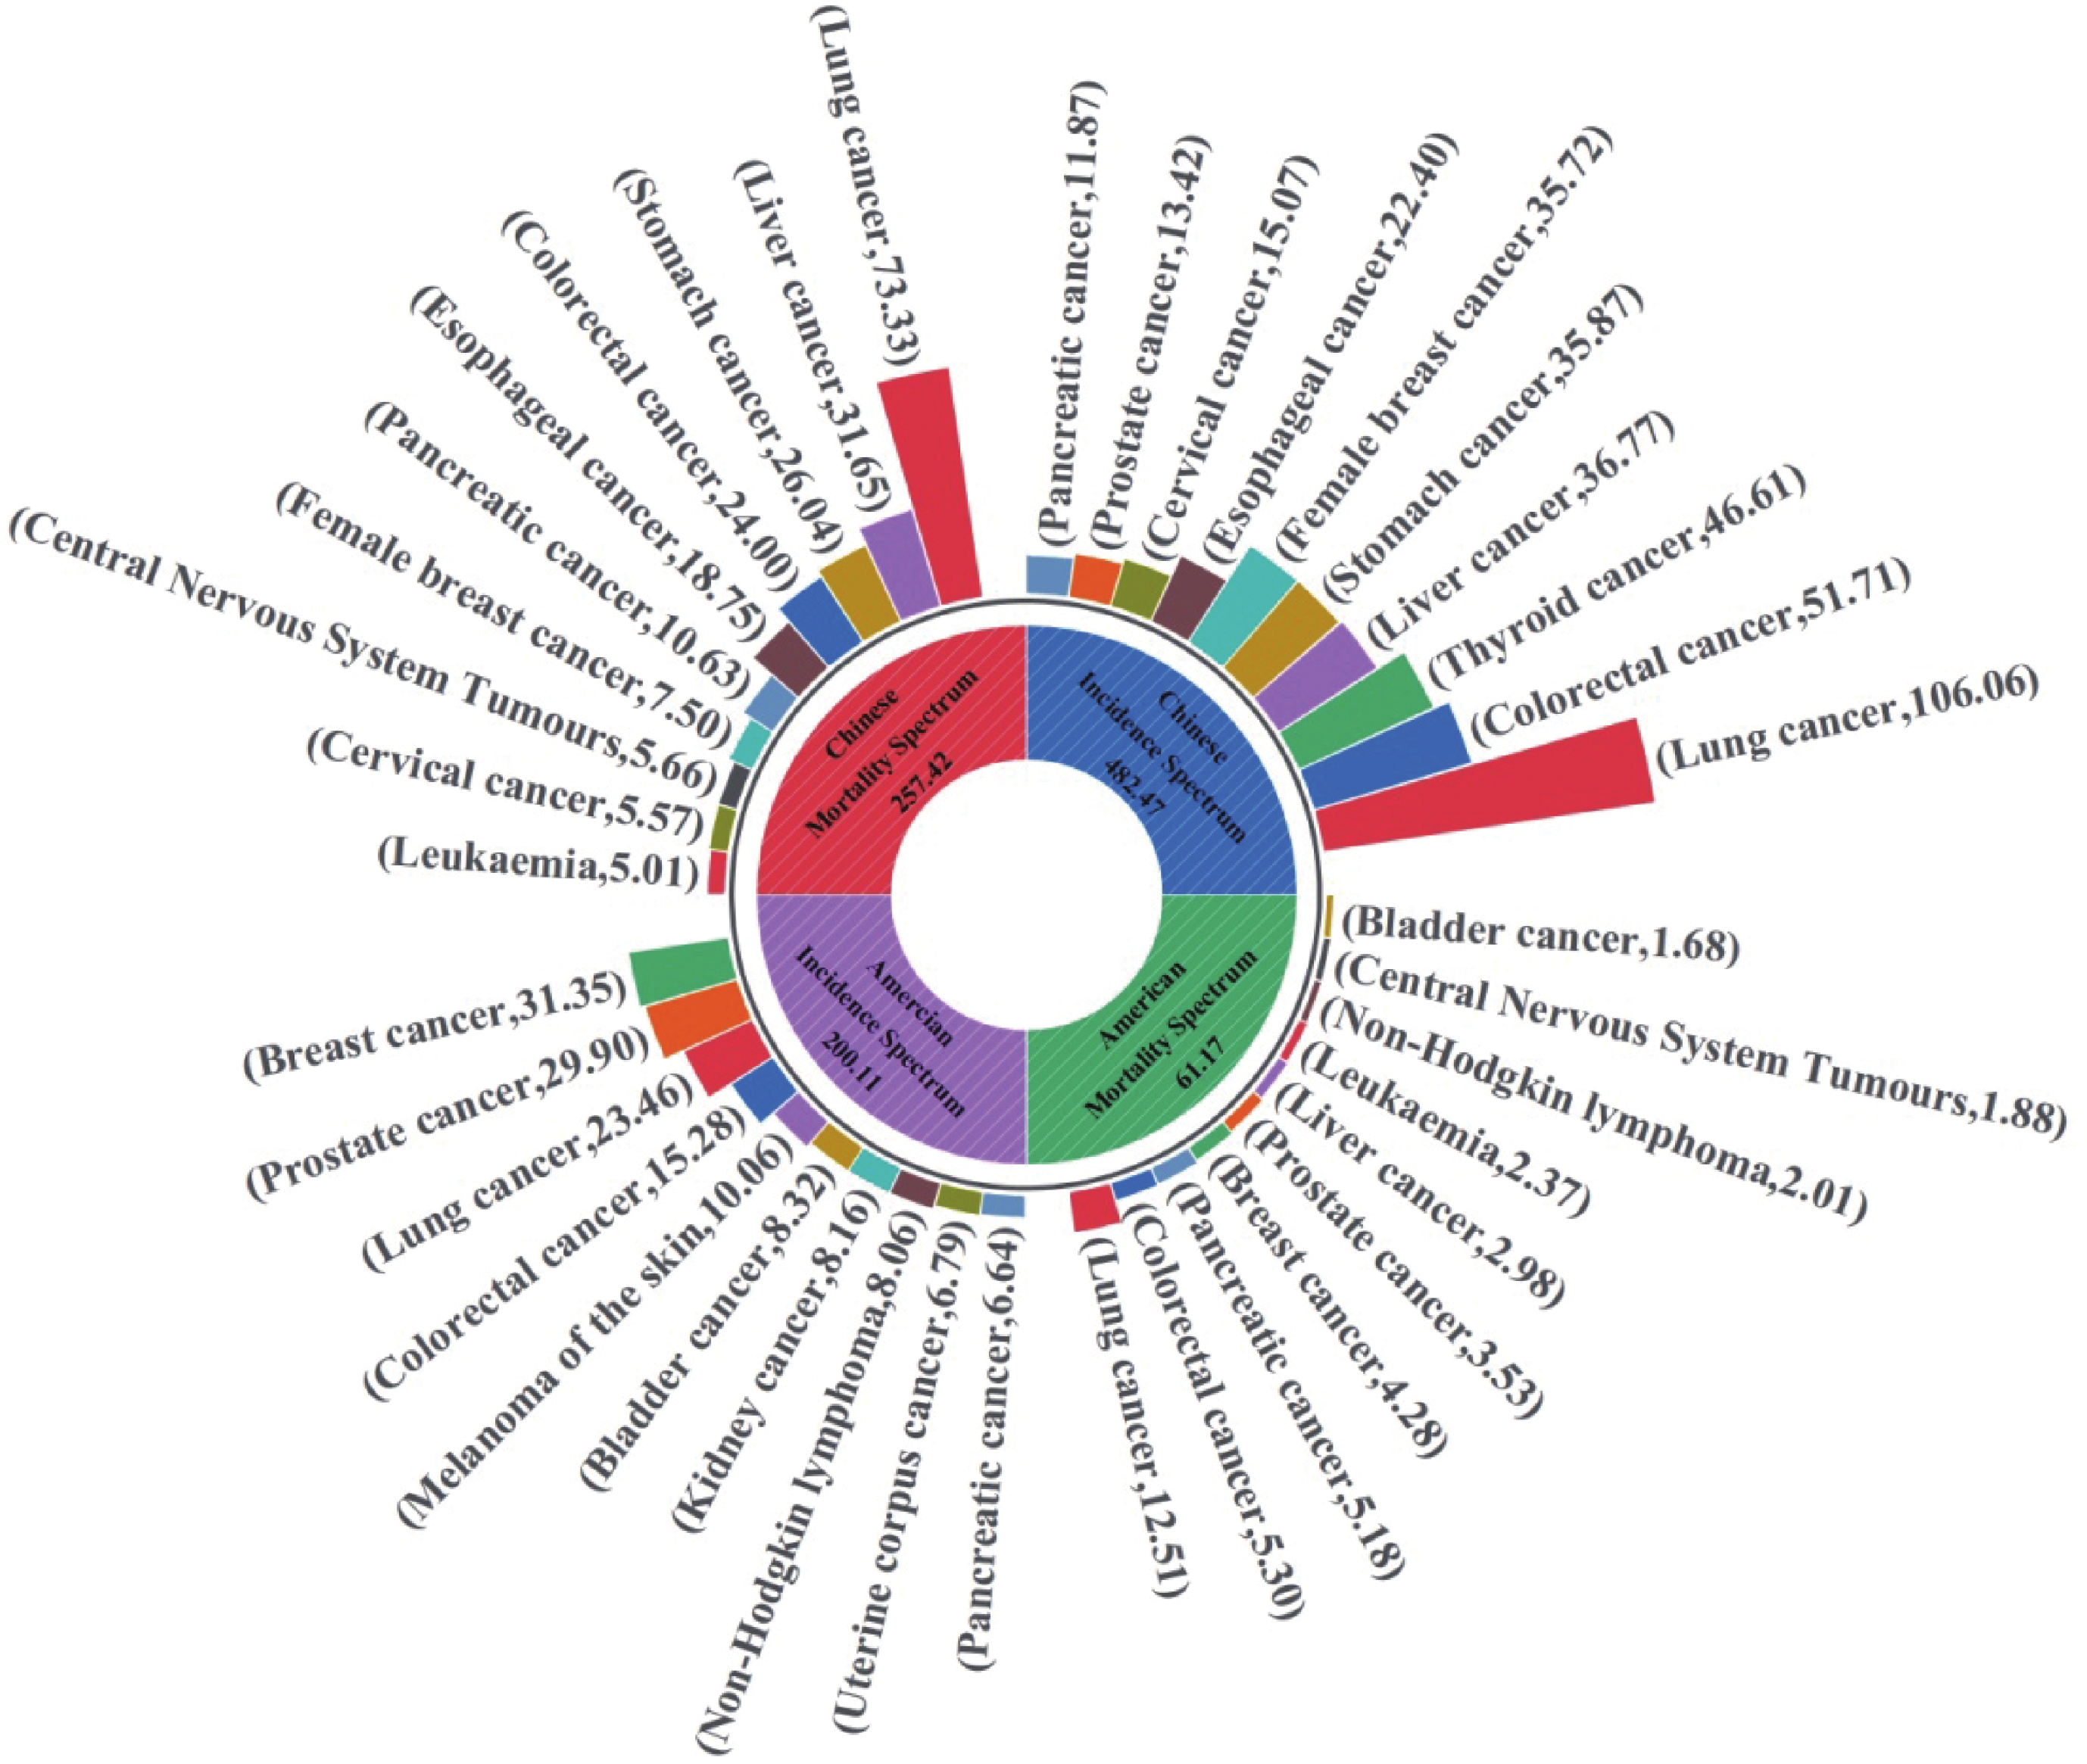
图 5 中美最新癌症发病谱及死因谱比较(单位:万例)
Figure 5 Comparison of the latest cancer incidence spectrum and cause of death spectrum between China and the United States (unit:
10000 cases)![]()
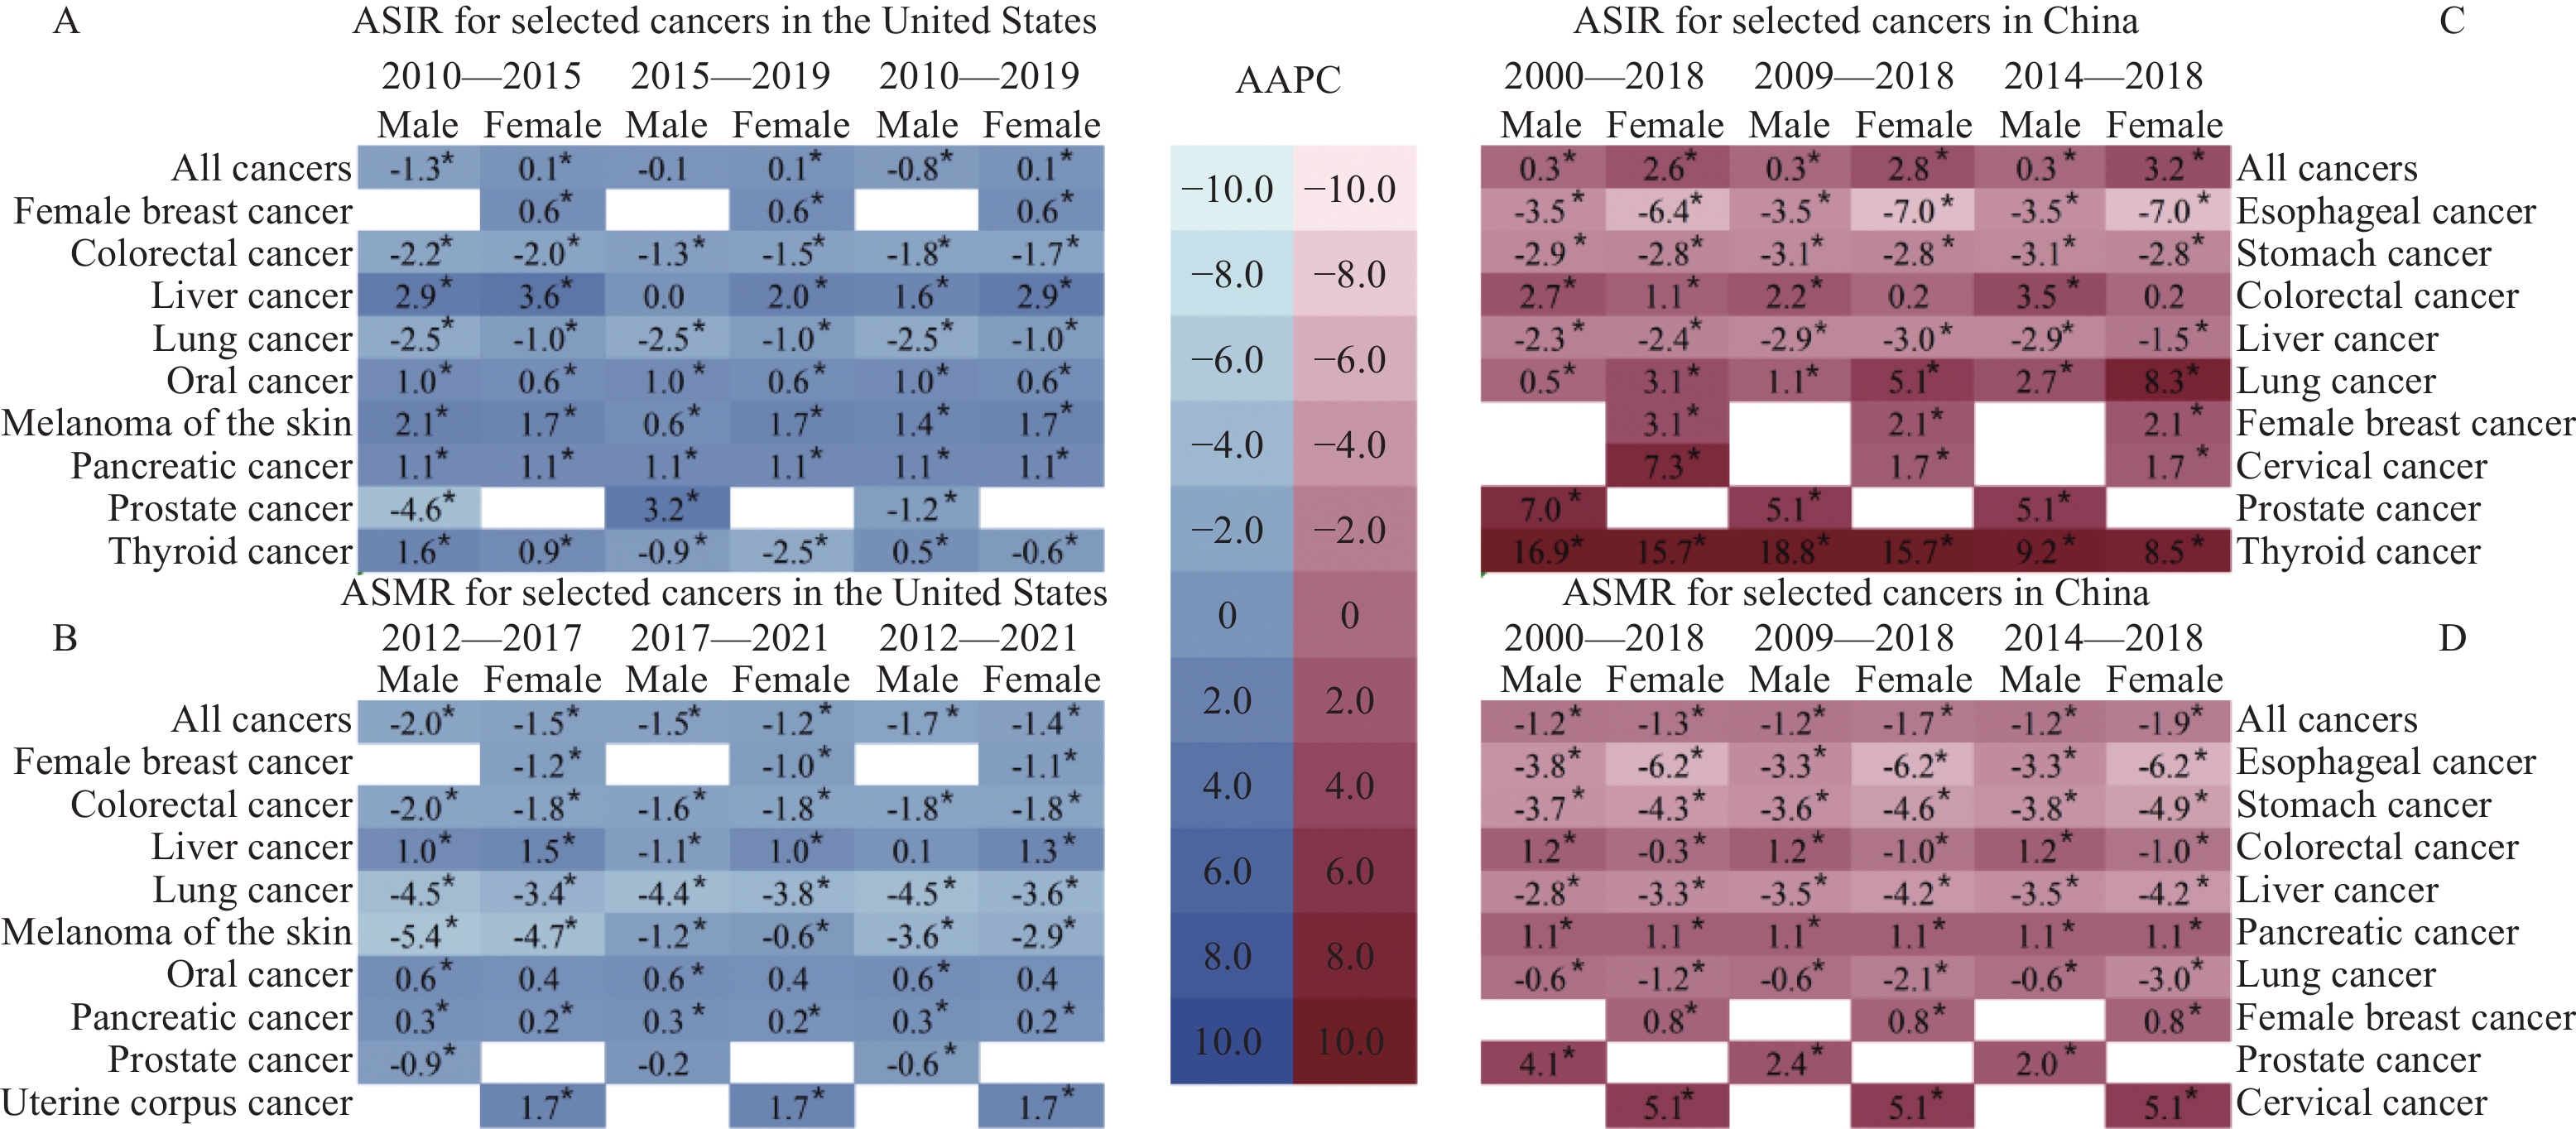
图 6 中美主要癌症年龄标化率平均年度变化百分比比较(%)
Figure 6 Comparison of the average annual percentage change in age-standardized rates for selected cancers between China and the United States (%)
表 1 2024年美国全人群及按性别预估的前十位癌症新发和死亡病例数
Table 1 Estimated number of new cases and deaths of the top 10 cancers in the United States in 2024 for the entire population and by sex
Cancer sites Estimated new cases Cancer sites Estimated deaths Cases Percent (%) Cases Percent (%) Both sexes Both sexes All sites 2001, 140 100.00 All sites 611, 720 100.00 Breast 313, 510 15.67 Lung and bronchus 125, 070 20.45 Prostate 299, 010 14.94 Colon and rectum 53, 010 8.67 Lung and bronchus 234, 580 11.72 Pancreas 51, 750 8.46 Colon and rectum 152, 810 7.64 Breast 42, 780 6.99 Melanoma of the skin 100, 640 5.03 Prostate 35, 250 5.76 Urinary bladder 83, 190 4.16 Liver and intrahepatic bile duct 29, 840 4.88 Kidney and renal pelvis 81, 610 4.08 Leukemia 23, 670 3.87 Non-Hodgkin lymphoma 80, 620 4.03 Non-Hodgkin lymphoma 20, 140 3.29 Uterine corpus 67, 880 3.39 Brain and other nervous system 18, 760 3.07 Pancreas 66, 440 3.32 Urinary bladder 16, 840 2.75 Male Male All sites 1029, 080 100.00 All sites 322, 800 100.00 Prostate 299, 010 29.06 Lung and bronchus 65, 790 20.38 Lung and bronchus 116, 310 11.30 Prostate 35, 250 10.92 Colon and rectum 81, 540 7.92 Colon and rectum 28, 700 8.89 Urinary bladder 63, 070 6.13 Pancreas 27, 270 8.45 Melanoma of the skin 59, 170 5.75 Liver and intrahepatic bile duct 19, 120 5.92 Kidney and renal pelvis 52, 380 5.09 Leukemia 13, 640 4.23 Non-Hodgkin lymphoma 44, 590 4.33 Esophagus 12, 880 3.99 Oral cavity and pharynx 41, 510 4.03 Urinary bladder 12, 290 3.81 Leukemia 36, 450 3.54 Non-Hodgkin lymphoma 11, 780 3.65 Pancreas 34, 530 3.36 Brain and other nervous system 10, 690 3.31 Female Female All sites 972, 060 100.00 All sites 288, 920 100.00 Breast 310, 720 31.97 Lung and bronchus 59, 280 20.52 Lung and bronchus 118, 270 12.17 Breast 42, 250 14.62 Colon and rectum 71, 270 7.33 Pancreas 24, 480 8.47 Uterine corpus 67, 880 6.98 Colon and rectum 24, 310 8.41 Melanoma of the skin 41, 470 4.27 Uterine corpus 13, 250 4.59 Non-Hodgkin lymphoma 36, 030 3.71 Ovary 12, 740 4.41 Pancreas 31, 910 3.28 Liver and intrahepatic bile duct 10, 720 3.71 Thyroid 31, 520 3.24 Leukemia 10, 030 3.47 Kidney and renal pelvis 29, 230 3.01 Non-Hodgkin lymphoma 8, 360 2.89 Leukemia 26, 320 2.71 Brain and other nervous system 8, 070 2.79 Notes: Data are obtained from reference [1]. The orders of morbidity and mortality are based on the number of cancer cases in each stratum.  下载: 导出CSV
表 2 2022年中国分性别主要癌症新发和死亡病例数及年龄标准化率
Table 2 Number and age-standardized rate of the new cases and deaths for selected cancers by sex in China in 2022
Cancer sites New cases ASIR
(1/105)Cancer sites Deaths ASMR
(1/105)Cases
(×104)Percent(%) Cases
(×104)Percent (%) Both sexes Both sexes All sites 482.47 100.00 201.61 All sites 257.42 100.00 96.47 Lung 106.06 21.98 40.78 Lung 73.33 28.49 26.66 Colon-rectum 51.71 10.72 20.10 Liver 31.65 12.30 12.59 Thyroid 46.61 9.66 24.64 Stomach 26.04 10.12 9.39 Liver 36.77 7.62 15.03 Colon-rectum 24.00 9.32 8.56 Stomach 35.87 7.43 13.72 Esophagus 18.75 7.28 6.68 Female breast 35.72 7.40 33.04 Pancreas 10.63 4.13 3.88 Esophagus 22.40 4.64 8.32 Female breast 7.50 2.91 6.10 Cervix 15.07 3.12 13.83 Brain, CNS 5.66 2.20 2.51 Prostate 13.42 2.78 9.68 Cervix 5.57 2.16 4.54 Pancreas 11.87 2.46 4.44 Leukemia 5.01 1.95 2.37 Male Male All sites 253.39 100.00 209.61 All sites 162.93 100.00 127.49 Lung 65.87 26.00 52.03 Lung 51.59 31.66 39.51 Colon-rectum 30.77 12.14 24.74 Liver 22.98 14.10 19.14 Liver 26.79 10.57 22.72 Stomach 18.16 11.15 13.77 Stomach 24.66 9.73 19.47 Colon-rectum 14.26 8.75 10.85 Esophagus 16.75 6.61 13.09 Esophagus 14.04 8.62 10.70 Prostate 13.42 5.30 9.68 Pancreas 6.11 3.75 4.73 Thyroid 12.49 4.93 13.25 Prostate 4.75 2.92 3.26 Bladder 7.32 2.89 5.67 Bladder 3.25 1.99 2.31 Pancreas 6.71 2.65 5.29 Brain, CNS 3.16 1.94 2.88 Lymphoma 4.81 1.90 4.34 Leukemia 2.92 1.79 2.78 Female Female All sites 229.08 100.00 197.03 All sites 94.49 100.00 67.81 Lung 40.19 17.54 30.34 Lung 21.74 23.01 14.71 Female breast 35.72 15.59 33.04 Colon-rectum 9.74 10.31 6.48 Thyroid 34.12 14.89 36.51 Liver 8.68 9.19 6.15 Colon-rectum 20.94 9.14 15.70 Stomach 7.88 8.34 5.34 Cervix 15.07 6.58 13.83 Female breast 7.50 7.94 6.10 Stomach 11.21 4.89 8.29 Cervix 5.57 5.89 4.54 Liver 9.98 4.36 7.42 Esophagus 4.71 4.98 2.92 Uterus 7.77 3.39 6.84 Pancreas 4.52 4.78 3.06 Ovary 6.11 2.67 5.68 Ovary 3.26 3.45 2.64 Esophagus 5.65 2.47 3.78 Brain, CNS 2.51 2.66 2.15 Notes: Data are obtained from reference [19]; ASIR: age-standardized incidence rate; ASMR: age-standardized mortality rate.
下载: 导出CSV
-
[1] Siegel RL, Giaquinto AN, Jemal A. Cancer statistics, 2024[J]. CA Cancer J Clin, 2024, 74(1): 12-49. doi: 10.3322/caac.21820
[2] Siegel RL, Miller KD, Wagle NS, et al. Cancer statistics, 2023[J]. CA Cancer J Clin, 2023, 73(1): 17-48. doi: 10.3322/caac.21763
[3] Silverberg E, Grant RN. Cancer statistics, 1970[J]. CA Cancer J Clin, 1970, 20(1): 11-23.
[4] Siegel RL, Miller KD, Jemal A. Cancer statistics, 2020[J]. CA Cancer J Clin, 2020, 70(1): 7-30. doi: 10.3322/caac.21590
[5] Siegel RL, Miller KD, Fuchs HE, et al. Cancer Statistics, 2021[J]. CA Cancer J Clin, 2021, 71(1): 7-33. doi: 10.3322/caac.21654
[6] Siegel RL, Miller KD, Fuchs HE, et al. Cancer statistics, 2022[J]. CA Cancer J Clin, 2022, 72(1): 7-33. doi: 10.3322/caac.21708
[7] Surveillance, Epidemiology, and End Results (SEER) Program. SEER*Stat Database: Incidence-SEER Research Data, 8 Registries, November 2022 Submission (1975–2020)-Linked To County Attributes-Time Dependent (1990–2021) Income/Rurality, 1969–2021 Counties[J]. National Cancer Institute, Division of Cancer Control and Population Sciences, Surveillance Research Program, 2023.
[8] Surveillance, Epidemiology, and End Results (SEER) Program. SEER*Stat Database: North American Association of Central Cancer Registries (NAACCR) Incidence Data—Cancer in North America Research Data, 2016–2020, Delay Adjusted Factors—American Cancer Society Facts and Figures (which includes data from the Centers for Disease Control and Prevention’s National Program of Cancer Registries, the Canadian Cancer Registry’s Provincial and Territorial Registries, and the National Cancer Institute’s SEER Registries, certified by the NAACCR as meeting high-quality incidence data standards for the specified time periods)[J]. National Cancer Institute, Division of Cancer Control and Population Sciences, Surveillance Research Program, 2023.
[9] Surveillance, Epidemiology, and End Results (SEER) Program. SEER*Stat Database: North American Association of Central Cancer Registries (NAACCR) Incidence Data—Cancer in North America Research Data, 1998–2020, Delay Adjusted Factors—American Cancer Society Facts and Figures (which includes data from the Centers for Disease Control and Prevention’s National Program of Cancer Registries, the Canadian Cancer Registry’s Provincial and Territorial Registries, and the National Cancer Institute’s SEER Registries, certified by the NAACCR as meeting high-quality incidence data standards for the specified time periods)[J]. National Cancer Institute, Division of Cancer Control and Population Sciences, Surveillance Research Program, 2023.
[10] Surveillance, Epidemiology, and End Results (SEER) Program. SEER*Stat Database: North American Association of Central Cancer Registries (NAACCR) Incidence Data—Cancer in North America Research Data, 1995–2020, with Race/Ethnicity, Standard File, American Cancer Society Facts and Figures (which includes data from the Centers for Disease Control and Prevention’s National Program of Cancer Registries, the Canadian Cancer Registry’s Provincial and Territorial Registries, and the National Cancer Institute’s SEER Registries, certified by the NAACCR as meeting high-quality incidence data standards for the specified time periods)[J]. National Cancer Institute, Division of Cancer Control and Population Sciences, Surveillance Research Program, 2023.
[11] Percy C, van Holten V, Muir C. International classification of diseases for oncology[M]. 2nd edition. Geneva: World Health Organization, 1990.
[12] Steliarova-Foucher E, Stiller C, Lacour B, et al. International Classification of Childhood Cancer, third edition[J]. Cancer, 2005, 103(7): 1457-1467. doi: 10.1002/cncr.20910
[13] Steliarova-Foucher E, Colombet M, Ries LAG, et al. International incidence of childhood cancer, 2001-10: a population-based registry study[J]. Lancet Oncol, 2017, 18(6): 719-731. doi: 10.1016/S1470-2045(17)30186-9
[14] Roth T, Coulouvrat C, Hajak G, et al. Prevalence and perceived health associated with insomnia based on DSM-IV-TR; International Statistical Classification of Diseases and Related Health Problems, Tenth Revision; and Research Diagnostic Criteria/International Classification of Sleep Disorders, Second Edition criteria: results from the America Insomnia Survey[J]. Biol Psychiatry, 2011, 69(6): 592-600. doi: 10.1016/j.biopsych.2010.10.023
[15] Mcguire V, Lichtensztajn DY, Tao L, et al. Variation in patterns of second primary malignancies across U. S. race and ethnicity groups: a Surveillance, Epidemiology, and End Results (SEER) analysis[J]. Cancer Causes Control, 2024, 35(5): 799-815. doi: 10.1007/s10552-023-01836-2
[16] 刘宗超, 李哲轩, 张阳, 等. 2020全球癌症统计报告解读[J]. 肿瘤综合治疗电子杂志, 2021, 7(2): 1-13. [Liu ZC, Li ZX, Zhang Y, et al. Interpretation on the report of Global Statistics 2020[J]. Zhong Liu Zong He Zhi Liao Dian Zi Za Zhi, 2021, 7(2): 1-13.] Liu ZC, Li ZX, Zhang Y, et al. Interpretation on the report of Global Statistics 2020[J]. Zhong Liu Zong He Zhi Liao Dian Zi Za Zhi, 2021, 7(2): 1-13.
[17] Liu S, Wu X, Lopez AD, et al. An integrated national mortality surveillance system for death registration and mortality surveillance, China[J]. Bull World Health Organ, 2016, 94(1): 46-57. doi: 10.2471/BLT.15.153148
[18] GBD 2017 Causes of Death Collaborators. Global, regional, and national age-sex-specific mortality for 282 causes of death in 195 countries and territories, 1980-2017: a systematic analysis for the Global Burden of Disease Study 2017[J]. Lancet, 2018, 392(10159): 1736-1788. doi: 10.1016/S0140-6736(18)32203-7
[19] Han B, Zheng R, Zeng H, et al. Cancer incidence and mortality in China, 2022[J]. J Natl Cancer Cent, 2024, 4(1): 47-53. doi: 10.1016/j.jncc.2024.01.006
[20] Qi J, Li M, Wang L, et al. National and subnational trends in cancer burden in China, 2005-20: an analysis of national mortality surveillance data[J]. Lancet Public Health, 2023, 8(12): e943-e955. doi: 10.1016/S2468-2667(23)00211-6
[21] Chen R, Aschmann HE, Chen YH, et al. Racial and Ethnic Disparities in Estimated Excess Mortality From External Causes in the US, March to December 2020[J]. JAMA Intern Med, 2022, 182(7): 776-778. doi: 10.1001/jamainternmed.2022.1461
[22] Green J, Cairns BJ, Casabonne D, et al. Height and cancer incidence in the Million Women Study: prospective cohort, and meta-analysis of prospective studies of height and total cancer risk[J]. Lancet Oncol, 2011, 12(8): 785-794. doi: 10.1016/S1470-2045(11)70154-1
[23] Klein SL, Flanagan KL. Sex differences in immune responses[J]. Nat Rev Immunol, 2016, 16(10): 626-638. doi: 10.1038/nri.2016.90
[24] Jackson SS, Marks MA, Katki HA, et al. Sex disparities in the incidence of 21 cancer types: Quantification of the contribution of risk factors[J]. Cancer, 2022, 128(19): 3531-3540. doi: 10.1002/cncr.34390
[25] Siegel RL, Torre LA, Soerjomataram I, et al. Global patterns and trends in colorectal cancer incidence in young adults[J]. Gut, 2019, 68(12): 2179-2185. doi: 10.1136/gutjnl-2019-319511
[26] Forjaz G, Ries L, Devasia TP, et al. Long-term Cancer Survival Trends by Updated Summary Stage[J]. Cancer Epidemiol Biomarkers Prev, 2023, 32(11): 1508-1517. doi: 10.1158/1055-9965.EPI-23-0589
[27] Xu X, Chen L, Nunez-Smith M, et al. Racial disparities in diagnostic evaluation of uterine cancer among Medicaid beneficiaries[J]. J Natl Cancer Inst, 2023, 115(6): 636-643. doi: 10.1093/jnci/djad027
[28] 胡志强, 游伟程, 潘凯枫, 等. 中、美两国癌症流行特征分析——《2023美国癌症统计报告》解读[J]. 科技导报, 2023, 41(18): 18-28. [Hu ZQ, You WC, Pan KF, et al. Epidemiological characteristics of cancers in China and American: Interpretation of the report of American cancer statistics, 2023[J]. Ke Ji Dao Bao, 2023, 41(18): 18-28.] Hu ZQ, You WC, Pan KF, et al. Epidemiological characteristics of cancers in China and American: Interpretation of the report of American cancer statistics, 2023[J]. Ke Ji Dao Bao, 2023, 41(18): 18-28.
[29] Zhou M, Wang H, Zeng X, et al. Mortality, morbidity, and risk factors in China and its provinces, 1990-2017: a systematic analysis for the Global Burden of Disease Study 2017[J]. Lancet, 2019, 394(10204): 1145-1158. doi: 10.1016/S0140-6736(19)30427-1
[30] Qi J, Wang L, Zhou M, et al. Mortality of Common Gastrointestinal Tract Cancers - Huai River Basin, 2008-2018[J]. China CDC Wkly, 2020, 2(16): 259-264.
[31] Zhang M, Zhong Y, Zhao Z, et al. Cervical Cancer Screening Rates Among Chinese Women - China, 2015[J]. China CDC Wkly, 2020, 2(26): 481-486. doi: 10.46234/ccdcw2020.128
[32] Zhang M, Zhong Y, Bao H, et al. Breast Cancer Screening Rates Among Women Aged 20 Years and Above - China, 2015[J]. China CDC Wkly, 2021, 3(13): 267-273. doi: 10.46234/ccdcw2021.078
[33] Fan X, Qin X, Zhang Y, et al. Screening for gastric cancer in China: Advances, challenges and visions[J]. Chin J Cancer Res, 2021, 33(2): 168-180. doi: 10.21147/j.issn.1000-9604.2021.02.05
[34] Liu F, Guo F, Zhou Y, et al. The Anyang Esophageal Cancer Cohort Study: study design, implementation of fieldwork, and use of computer-aided survey system[J]. PLoS One, 2012, 7(2): e31602. doi: 10.1371/journal.pone.0031602
[35] Chen R, Liu Y, Song G, et al. Effectiveness of one-time endoscopic screening programme in prevention of upper gastrointestinal cancer in China: a multicentre population-based cohort study[J]. Gut, 2021, 70(2): 251-260.
[36] Wei WQ, Chen ZF, He YT, et al. Long-Term Follow-Up of a Community Assignment, One-Time Endoscopic Screening Study of Esophageal Cancer in China[J]. J Clin Oncol, 2015, 33(17): 1951-1957. doi: 10.1200/JCO.2014.58.0423
[37] Zheng R, Qu C, Zhang S, et al. Liver cancer incidence and mortality in China: Temporal trends and projections to 2030[J]. Chin J Cancer Res, 2018, 30(6): 571-579. doi: 10.21147/j.issn.1000-9604.2018.06.01
[38] Qiu H, Cao S, Xu R. Cancer incidence, mortality, and burden in China: a time-trend analysis and comparison with the United States and United Kingdom based on the global epidemiological data released in 2020[J]. Cancer Commun (Lond), 2021, 41(10): 1037-1048. doi: 10.1002/cac2.12197
[39] Lu L, Mullins CS, Schafmayer C, et al. A global assessment of recent trends in gastrointestinal cancer and lifestyle-associated risk factors[J]. Cancer Commun (Lond), 2021, 41(11): 1137-1151. doi: 10.1002/cac2.12220
[40] 尹周一, 王梦圆, 游伟程, 等. 2022美国癌症统计报告解读及中美癌症流行情况对比[J]. 肿瘤综合治疗电子杂志, 2022, 8(2): 54-63. [Yin ZY, Wang MY, You WC, et al. Interpretation on the report of American cancer statitics, 2022 and comparison of cancer prevalence in China and America[J]. Zhong Liu Zong He Zhi Liao Dian Zi Za Zhi, 2022, 8(2): 54-63.] Yin ZY, Wang MY, You WC, et al. Interpretation on the report of American cancer statitics, 2022 and comparison of cancer prevalence in China and America[J]. Zhong Liu Zong He Zhi Liao Dian Zi Za Zhi, 2022, 8(2): 54-63.
[41] Bray F, Jemal A, Grey N, et al. Global cancer transitions according to the Human Development Index (2008-2030): a population-based study[J]. Lancet Oncol, 2012, 13(8): 790-801. doi: 10.1016/S1470-2045(12)70211-5
计量
- 文章访问数: 3132
- HTML全文浏览量: 4271
- PDF下载量: 4390

