
Construction of A Nomogram Prognostic Model Based on Pretreatment Inflammatory Indicator for Esophageal Squamous Cell Carcinoma Patients Treated with Radical Radiotherapy
-
摘要:目的
探讨治疗前炎性反应指标对食管鳞癌(ESCC)患者根治性放疗疗效和预后预测价值。
方法收集接受根治性放疗的246例ESCC患者的临床资料。采用受试者工作特征(ROC)曲线计算血小板与淋巴细胞比值(PLR)、中性粒细胞与淋巴细胞比值(NLR)和全身免疫炎症指数(SII)的最佳截断值。采用Kaplan-Meier法进行生存分析,Cox比例风险回归模型进行单因素和多因素分析,R4.2.0软件构建列线图预测模型。
结果根据ROC曲线确定PLR、NLR和SII的最佳截断值分别为146.06、2.67和493.97。低NLR组和高NLR组的总缓解率(ORR)分别为77.6%和64.5%(P<0.05)。Kaplan-Meier生存分析显示,低PLR、NLR和SII组患者的生存预后均优于高PLR、NLR和SII组,差异均有统计学意义(均P<0.05)。多因素分析显示,性别、治疗方式、T分期和NLR均是影响患者总生存(OS)的独立预后因素,T分期和NLR是影响患者无进展生存(PFS)的独立预后因素(均P<0.05)。根据多因素分析构建ESCC患者OS和PFS的列线图预测模型,C指数分别为0.703和0.668,校准曲线表明列线图模型预测患者OS、PFS与实际观察结果之间具有较高的一致性。
结论治疗前PLR、NLR和SII与ESCC患者根治性放疗预后有关,NLR是OS和PFS的独立影响因素,基于NLR建立的列线图模型具有较好的预测能力。
Abstract:ObjectiveTo describe the significance of the pretreatment inflammatory indicators in predicting the prognosis of patients with esophageal squamous cell carcinoma (ESCC) after undergoing radical radiotherapy.
MethodsThe data of 246 ESCC patients who underwent radical radiotherapy were retrospectively collected. Receiver operating characteristic (ROC) curves were drawn to determine the optimal cutoff values for platelet-lymphocyte ratio (PLR), neutrophil-lymphocyte ratio (NLR), and systemic immune-inflammation index (SII). The Kaplan-Meier method was used for survival analysis. We conducted univariate and multivariate analyses by using the Cox proportional risk regression model. Software R (version 4.2.0) was used to create the nomogram of prognostic factors.
ResultsThe results of the ROC curve analysis showed that the optimal cutoff values of PLR, NLR, and SII were 146.06, 2.67, and 493.97, respectively. The overall response rates were 77.6% and 64.5% in the low and high NLR groups, respectively (P<0.05). The results of the Kaplan-Meier survival analysis revealed that the prognosis of patients in the low PLR, NLR, and SII group was better than that of patients in the high PLR, NLR, and SII group (all P<0.05). The results of the multivariate Cox regression analysis showed that gender, treatment modalities, T stage, and NLR were independent factors affecting the overall survival (OS). In addition, T stage and NLR were independent factors affecting the progression-free survival (PFS) (all P<0.05). The nomogram models of OS and PFS prediction were established based on multivariate analysis. The C-index values were 0.703 and 0.668. The calibration curves showed excellent consistency between the predicted and observed OS and PFS.
ConclusionThe pretreatment values of PLR, NLR, and SII are correlated with the prognosis of patients with ESCC who underwent radical radiotherapy. Moreover, NLR is an independent factor affecting the OS and PFS of ESCC patients. The NLR-based nomogram model has a good predictive ability.
-
Key words:
- Esophageal squamous cell carcinoma /
- Radiotherapy /
- Inflammatory indicator /
- Prognosis /
- Nomogram
-
0 引言
食管癌是全球第七大癌症相关死亡原因[1]。我国是食管癌高发地区,2022年我国食管癌新发和死亡病例分别为22.40万例和18.75万例,分别位居恶性肿瘤发病率第7位和死亡率第5位。食管鳞癌(Esophageal squamous cell carcinoma, ESCC)是食管癌最常见的病理类型,约占食管癌患者的90%[2-3]。根治性同步放化疗是早期拒绝手术和不可切除局部晚期ESCC患者标准治疗手段[4-6]。然而,由于较高的复发率和病死率,ESCC的治疗效果远不能令人满意[7-8]。目前尚缺乏有效可靠的ESCC预后生物标志物。炎性反应与肿瘤的发生发展密切相关[9-10]。研究表明,炎性反应标志物如中性粒细胞与淋巴细胞比值(Neutrophil-lymphocyte ratio, NLR)、血小板与淋巴细胞比值(Platelet-lymphocyte ratio, PLR)、C-反应蛋白与白蛋白比值(C-reactive protein albumin ratio, CAR)和全身免疫炎症指数(Systemic immune inflammatory index, SII)等与多种恶性肿瘤的预后相关[11-14]。然而,关于PLR、NLR、SII与ESCC根治性放疗疗效和预后的研究不多。
基于此,本研究旨在探讨治疗前PLR、NLR和SII对ESCC根治性放疗疗效和预后的预测价值,并构建基于炎性反应指标的列线图预测模型,以期更精确地指导ESCC的临床治疗和预测预后。
1 资料与方法
1.1 临床资料
回顾性收集2014年1月至2018年12月就诊于陕西省肿瘤医院接受根治性放疗的246例ESCC患者的临床资料。根据美国癌症联合委员会(AJCC)第6版食管癌分期系统进行临床TNM分期。纳入标准:(1)年龄≥18岁;(2)KPS评分≥80分;(3)经病理确诊为ESCC;(4)采用三维适形/调强技术放疗,同步化疗方案为以铂类或氟尿嘧啶为基础的单药或联合方案;(5)临床信息和随访资料完整。排除标准:(1)伴远处转移或合并其他部位恶性肿瘤;(2)合并血液系统、免疫系统及急性感染性疾病;(3)既往接受过放化疗等其他抗肿瘤治疗。本研究通过陕西省肿瘤医院伦理委员会批准[医伦审(2023)第62号]。
1.2 治疗前血液学指标计算
收集患者治疗前1周内血常规指标,包括中性粒细胞计数、淋巴细胞计数、血小板计数。计算PLR、NLR、SII,计算公式如下:PLR=血小板计数/淋巴细胞计数,NLR=中性粒细胞计数/淋巴细胞计数,SII=血小板计数×中性粒细胞计数/淋巴细胞计数。
1.3 随访
所有患者在完成治疗后进行定期随访。放疗结束后1月内复查食管钡餐或胸部CT进行近期疗效评价,结果包括完全缓解(Complete response, CR)、部分缓解(Partial response, PR)、疾病稳定(Stable disease, SD)和疾病进展(Progressive disease, PD),总缓解率(Overall response rate, ORR)=CR+PR。治疗后2年内每3个月检查1次,3~5年内每6个月检查1次,5年后每年检查1次。随访内容主要包括体格检查、食管钡餐、胸腹部CT、颈部B型超声、内镜检查。随访截止时间为2022年12月,中位随访时间23.5个月(2.6~100.5个月)。总生存期(Overall survival, OS)定义为从开始治疗至死亡或随访截止日期,无进展生存期(Progression-free survival, PFS)定义为从开始治疗至肿瘤局部复发、转移或死亡的时间。
1.4 统计学方法
应用SPSS 21.0和GraphPad Prism5.0软件进行统计学分析。通过绘制受试者工作特征(Receiver operating characteristic, ROC)曲线计算PLR、NLR和SII最佳截断值。应用χ2检验进行组间比较。采用Kaplan-Meier法进行生存分析,GraphPad Prism 5.0绘制患者生存曲线。采用Cox比例风险回归模型进行单因素和多因素分析。R4.2.0软件绘制预后列线图,采用Bootstrap法重复抽样1 000次进行列线图模型的内部验证,通过计算一致性指数(C-index)值来评估模型的预测能力。采用校正曲线图分析实际结果和预测概率之间的一致性。P<0.05代表差异有统计学意义。
2 结果
2.1 ESCC患者临床特征资料与生存分析
本研究共纳入了246例ESCC患者,年龄41~91岁(中位68岁)。TNM分期Ⅰ期5例(2.0%),Ⅱ期117例(47.6%),Ⅲ期124例(50.4%)。180例患者接受根治性放疗(73.2%),66例接受根治性放化疗(26.8%)。具体临床特征见表1。
表 1 246例ESCC患者的临床特征Table 1 Clinicopathological characteristics of 246 esophageal squamous cell carcinoma (ESCC) patientsCharacteristics n (%) Age(years) <65 69(28.0) ≥65 177(72.0) Gender Male 166(67.5) Female 80(32.5) Length of tumor(cm) <5 122(49.6) ≥5 124(50.4) T stage T1 5(2.0) T2 38(15.4) T3 169(68.7) T4 34(13.8) N stage N0 123(50.0) N1 123(50.0) TNM stage Ⅰ 5(2.0) Ⅱ 117(47.6) Ⅲ 124(50.4) Treatment modalities CRT 66(26.8) RT 180(73.2) Notes: CRT: chemotherapy+radiotherapy; RT: radiotherapy. 生存分析显示,患者的1、3和5年OS率依次为78.5%、38.0%和28.9%,PFS率依次为55.1%、31.7%和24.8%。按临床病理特征对患者进行分层分析,发现不同性别、肿瘤长度、T分期、TNM分期、治疗方式的患者OS差异有统计学意义(均P<0.05),见图1。不同性别、肿瘤长度、T分期、TNM分期的患者PFS有统计学意义(均P<0.05),见图2。
2.2 PLR、NLR和SII的最佳截断值确定
采用ROC曲线对PLR、NLR和SII取截断值,PLR、NLR和SII的最佳截断值分别为146.06、2.67和493.97。PLR、NLR和SII的曲线下面积(Area under the curve, AUC)分别为0.659(95%CI: 0.590~0.729)、0.680(95%CI: 0.612~0.748)和0.669(95%CI: 0.599~0.739)(均P<0.05),见图3。分别以PLR、NLR和SII的最佳截断值,将患者分为低PLR组(<146.06)和高PLR组(≥146.06)、低NLR组(<2.67)和高NLR组(≥2.67)、低SII组(<493.97)和高SII组(≥493.97)。
2.3 PLR、NLR和SII与ESCC患者临床特征的关系
不同PLR、NLR和SII分组患者的肿瘤长度差异均有统计学意义(均P<0.05),而且,低NLR组与高NLR组患者的性别、T分期、N分期和TNM分期差异有统计学意义(均P<0.05),低SII组与高SII组患者的性别、T分期和TNM分期差异有统计学意义(均P<0.05),见表2。
表 2 246例ESCC患者PLR、NLR和SII与临床特征的关系(n(%))Table 2 Correlation of PLR, NLR, and SII with clinical characteristics of 246 ESCC patients (n (%))Characteristics PLR P NLR P SII P <146.06
(n=111)≥146.06
(n=135)<2.67
(n=125)≥2.67
(n=121)<493.97
(n=103)≥493.97
(n=143)Age(years) 0.595 0.385 0.159 <65 33(29.7) 36(26.7) 32(25.6) 37(30.6) 24(23.3) 45(31.5) ≥65 78(70.3) 99(73.3) 93(74.4) 84(69.4) 79(76.7) 98(68.5) Gender 0.805 0.011 0.019 Male 74(66.7) 92(68.1) 75(60.0) 91(75.2) 61(59.2) 105(73.4) Female 37(33.3) 43(31.9) 50(40.0) 30(24.8) 42(40.8) 38(26.6) Length of tumor(cm) 0.005 0.001 <0.001 <5 66(59.5) 56(41.5) 75(60.0) 47(38.8) 65(63.1) 57(39.9) ≥5 45(40.5) 79(58.5) 50(40.0) 74 (61.2) 38(36.9) 86(60.1) T stage 0.060 0.001 <0.001 T1 4(3.6) 1(0.7) 5(4.0) 0(0.0) 5(4.9) 0(0.0) T2 21(18.9) 17(12.6) 24(19.2) 14(11.6) 21(20.4) 17(11.9) T3 76(68.5) 93(68.9) 88(70.4) 81(66.9) 72(69.9) 97(67.8) T4 10(9.0) 24(17.8) 8(6.4) 26(21.5) 5(4.9) 29(20.3) N stage 0.370 0.030 0.053 N0 59(53.2) 64(47.4) 71(56.8) 52(43.0) 59(57.3) 64(44.8) N1 52(46.8) 71(52.6) 54(43.2) 69(57.0) 44(42.7) 79(55.2) TNM stage 0.121 <0.001 0.001 Ⅰ 4(3.6) 1(0.7) 5(4.0) 0(0.0) 5(4.9) 0(0.0) Ⅱ 57(51.4) 60(44.4) 71(56.8) 46(38.0) 57(55.3) 60(42.0) Ⅲ 50(45.0) 74(54.8) 49(39.2) 75(62.0) 41(39.8) 83(58.0) Treatment modalities 0.521 0.199 0.490 CRT 32(28.8) 34(25.2) 38(30.4) 28(23.1) 30(29.1) 36(25.2) RT 79(71.2) 101(74.8) 87(69.6) 93(76.9) 73(70.9) 107(47.8) 2.4 PLR、NLR和SII与ESCC患者根治性放疗近期疗效的关系
所有患者放(化)疗后CR 41例,PR 134例,SD 54例,PD 17例,ORR为71.1%。低PLR组和高PLR组的ORR分别为73.9%和68.9%(P=0.391);低NLR组和高NLR组的ORR分别为77.6%和64.5%(P=0.023);低SII组和高SII组的ORR分别为77.7%和66.4%(P=0.055)。提示治疗前低NLR组患者具有更好的近期疗效,而PLR和SII与患者近期疗效无显著相关性。
2.5 PLR、NLR和SII对ESCC患者根治性放疗预后的影响
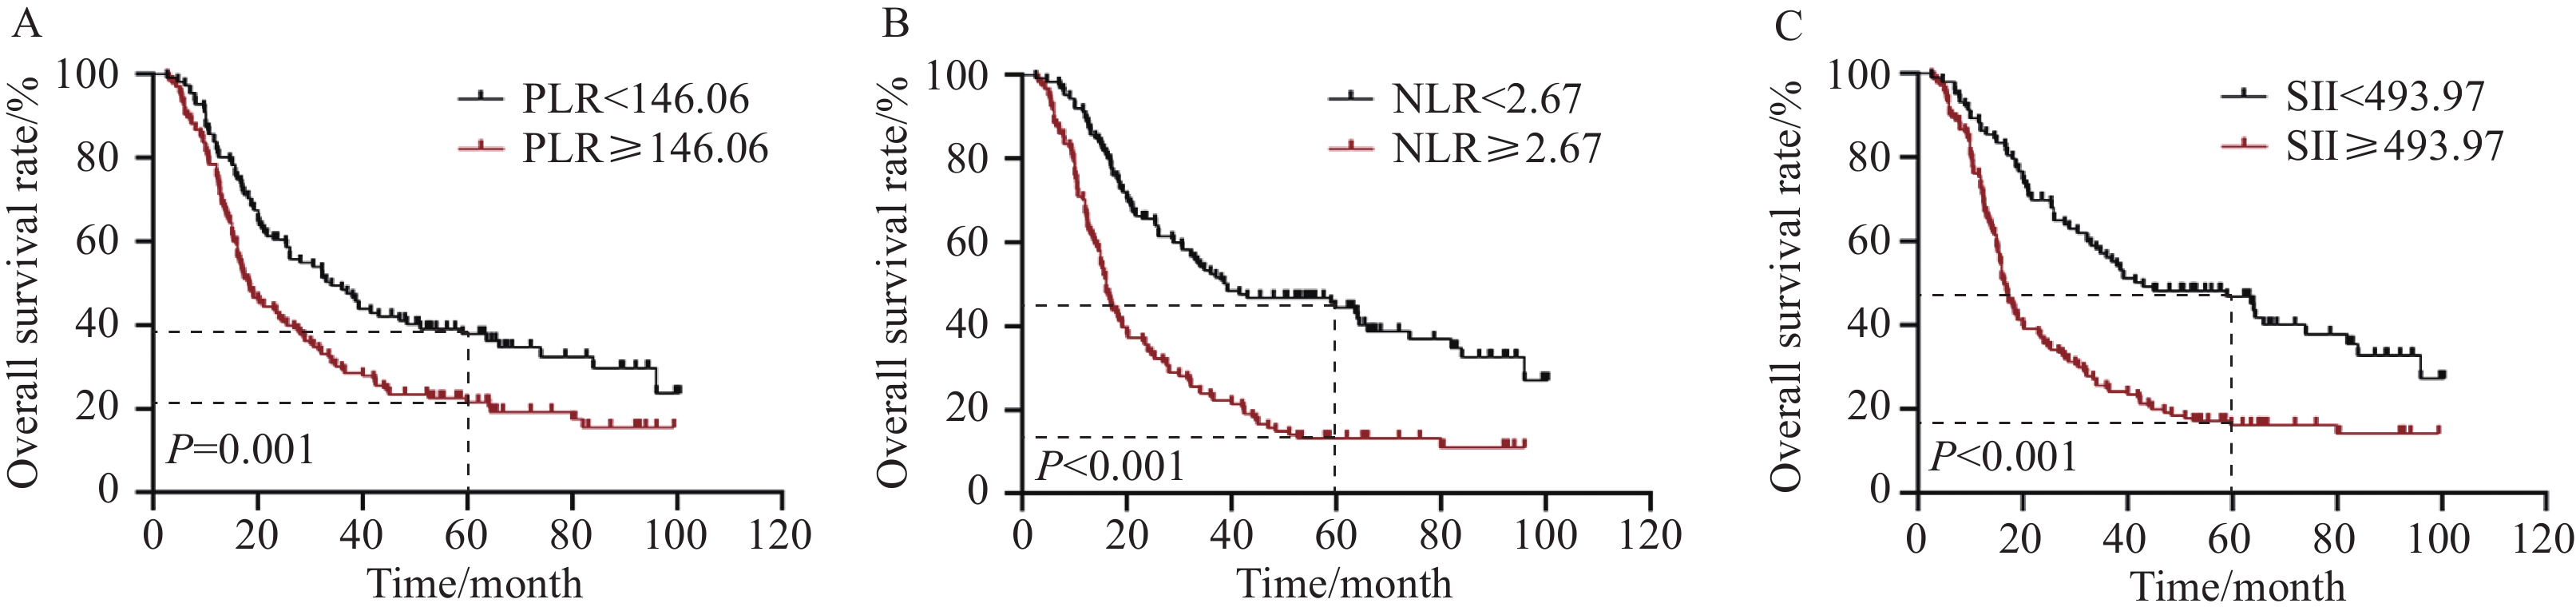
高水平的PLR、NLR和SII与患者较差预后相关。低PLR组和高PLR组的5年OS率分别为37.8%和21.6%(P=0.001),5年PFS率分别为32.5%和18.3%(P<0.001);低NLR组和高NLR组的5年OS率分别为44.4%和13.2%(P<0.001),5年PFS率分别为39.5%和9.9%(P<0.001);低SII组和高SII组的5年OS率分别为46.8%和16.2%(P<0.001),5年PFS率分别为41.2%和12.8%(P<0.001),见图4~5。
![]() 图 4 PLR(A)、NLR(B)和SII(C)对ESCC患者根治性放疗后OS的影响Figure 4 Effect of PLR (A), NLR (B), and SII (C) on OS of esophageal squamous cell carcinoma patients after radical radiotherapy
图 4 PLR(A)、NLR(B)和SII(C)对ESCC患者根治性放疗后OS的影响Figure 4 Effect of PLR (A), NLR (B), and SII (C) on OS of esophageal squamous cell carcinoma patients after radical radiotherapy![]() 图 5 PLR(A)、NLR(B)和SII(C)对ESCC患者根治性放疗后PFS的影响Figure 5 Effect of PLR (A), NLR (B), and SII (C) on PFS of esophageal squamous cell carcinoma patients after radical radiotherapy
图 5 PLR(A)、NLR(B)和SII(C)对ESCC患者根治性放疗后PFS的影响Figure 5 Effect of PLR (A), NLR (B), and SII (C) on PFS of esophageal squamous cell carcinoma patients after radical radiotherapy单因素分析显示,性别、肿瘤长度、治疗方式、T分期、TNM分期、PLR、NLR和SII均与患者OS有关(均P<0.05);性别、肿瘤长度、T分期、TNM分期、PLR、NLR和SII均与患者PFS有关(均P<0.05)。多因素分析显示,性别、治疗方式、T分期和NLR均是影响患者OS的独立预后因素;T分期和NLR是影响患者PFS的独立预后因素(均P<0.05),见表3~4。
表 3 ESCC患者根治性放疗后OS的单因素和多因素分析Table 3 Univariate and multivariate analyses for OS of ESCC patients after radical radiotherapyCharacteristics Univariate analysis Multivariate analysis HR (95%CI) P HR (95%CI) P Age 1.332 (0.948–1.870) 0.098 Gender 0.535 (0.383–0.747) <0.001 0.608 (0.429–0.863) 0.005 Length of tumor 1.374 (1.026–1.841) 0.033 0.993 (0.729–1.352) 0.963 T stage 1.988 (1.530–2.582) <0.001 1.875 (1.353–2.596) <0.001 N stage 1.294 (0.967–1.732) 0.083 TNM stage 1.742 (1.321–2.297) <0.001 0.938 (0.658–1.338) 0.725 Treatment modalities 0.653 (0.466–0.915) 0.013 0.591 (0.417–0.836) 0.003 PLR 1.613 (1.198–2.172) 0.002 0.987 (0.669–1.455) 0.947 NLR 2.382 (1.768–3.209) <0.001 1.615 (1.034–2.524) 0.035 SII 2.251 (1.650–3.069) <0.001 1.274 (0.775–2.095) 0.340 表 4 ESCC患者根治性放疗后PFS的单因素和多因素分析Table 4 Univariate and multivariate analyses for PFS of ESCC patients after radical radiotherapyCharacteristics Univariate analysis Multivariate analysis HR (95%CI) P HR (95%CI) P Age 1.135 (0.818–1.574) 0.449 Gender 0.634 (0.459–0.875) 0.006 0.794 (0.564–1.118) 0.186 Length of tumor 1.385 (1.035–1.854) 0.028 1.050 (0.775–1.423) 0.751 T stage 1.902 (1.471–2.460) <0.001 1.668 (1.214–2.290) 0.002 N stage 1.265 (0.946–1.691) 0.113 TNM stage 1.649 (1.255–2.167) <0.001 0.951 (0.668–1.354) 0.779 Treatment modalities 0.818 (0.591–1.133) 0.227 PLR 1.721 (1.279–2.315) <0.001 0.984 (0.668–1.450) 0.934 NLR 2.539 (1.883–3.423) <0.001 1.727 (1.101–2.709) 0.017 SII 2.425 (1.778–3.308) <0.001 1.384 (0.839–2.282) 0.203 2.6 列线图的构建与评价
基于多因素Cox回归模型的分析结果,纳入影响患者预后的独立危险因素,构建预测ESCC患者根治性放疗OS和PFS的列线图模型,见图6,C-index分别为0.703(95%CI: 0.663~0.744)和0.668(95%CI: 0.627~0.708),表明列线图模型有较好的预测效能。校准曲线表明列线图模型预测患者OS、PFS与实际观察结果之间具有较高的一致性,见图7。
![]() 图 6 ESCC患者根治性放疗后OS(A)和PFS(B)的列线图模型Figure 6 Nomogram models of OS (A) and PFS (B) prediction for ESCC patients after radical radiotherapy
图 6 ESCC患者根治性放疗后OS(A)和PFS(B)的列线图模型Figure 6 Nomogram models of OS (A) and PFS (B) prediction for ESCC patients after radical radiotherapy![]() 图 7 ESCC患者根治性放疗后OS(A)和PFS(B)的校准曲线Figure 7 Calibration curves of OS (A) and PFS (B) prediction for ESCC patients after radical radiotherapy
图 7 ESCC患者根治性放疗后OS(A)和PFS(B)的校准曲线Figure 7 Calibration curves of OS (A) and PFS (B) prediction for ESCC patients after radical radiotherapy3 讨论
炎性反应标志物,如PLR、NLR和SII,已被证实与肿瘤的发生和转移有关[15]。这些炎性反应指标的临床预后价值在肺癌、乳腺癌、胃癌等恶性肿瘤中都得到了证实[16-18],但与ESCC根治性放疗预后的研究有限[19]。本研究分析了治疗前PLR、NLR和SII对ESCC患者根治性放疗疗效和预后的预测价值。结果表明,治疗前PLR、NLR和SII与患者OS和PFS相关,NLR是OS和PFS的独立预后影响因素,治疗前低NLR组患者具有更好的近期疗效。我们根据多因素分析结果,基于NLR分别构建了预测ESCC患者OS和PFS的列线图模型,验证结果表明列线图模型有较好的预测效能。
炎性反应影响恶性肿瘤进展和预后的潜在机制是复杂的,目前仍不完全清楚,可能与以下机制有关。首先,中性粒细胞是人体循环中最丰富的白细胞,不仅参与机体炎性反应和损伤修复,还在肿瘤形成过程中发挥重要作用。研究发现,中性粒细胞通过促进肿瘤的发生、增殖、血管生成和转移,与多种恶性肿瘤不良预后有关[20-21]。中性粒细胞促进癌症发生和发展的机制很多,如抑制CD8+ T淋巴细胞凋亡和NK细胞的活性以及产生髓过氧化物酶、蛋白酶和活性氧等,从而发挥促肿瘤作用[22-24]。血小板是巨核细胞产生的无核细胞组分,参与止血、伤口愈合、炎性反应等生理过程。血小板在肿瘤的发生和发展中也扮演了重要角色,其增多与恶性肿瘤患者预后不良有关[25-26]。而服用抗血小板药物如阿司匹林可以降低乳腺癌、胃癌等的发病率和死亡率[27-28]。另外,淋巴细胞作为机体免疫应答功能的重要组成部分,对肿瘤发生和进展有抑制作用,淋巴细胞减少引起的免疫缺陷与肿瘤的发病率增加有关[29-30]。
PLR、NLR和SII为常见炎性反应标志物,可以有效反映机体炎性反应和抗肿瘤免疫功能,是有效的肿瘤预后预测标志物。一项Meta分析发现,NLR升高与食管癌较差的生存预后密切相关,提示NLR可作为食管癌患者预后生物标志物[31]。而关于上述炎性标志物与ESCC患者放疗预后关系的研究非常有限。Cai等[32]回顾性分析311例接受新辅助放化疗的进展期ESCC患者,治疗前SII和PLR与病理完全缓解(Pathological complete response, pCR)相关,SII和PLR是OS的独立影响因素。但该研究入组患者治疗方式为新辅助放化疗联合根治性手术,放疗剂量为40~50.4 Gy,每次1.8~2 Gy,5次/周,并未纳入接受根治性放疗的ESCC患者。Wu等[33]对105例接受根治性放疗的ESCC患者的回顾性研究表明,低NLR和PLR组患者的OS优于高NLR和PLR组,但多因素分析显示,NLR和PLR并不是独立预后因素。另一项回顾性研究纳入160例接受根治性同步放化疗的食管癌患者,结果表明,高SII的患者OS和PFS显著差于低SII的患者,而高水平肿瘤浸润淋巴细胞(Tumor-infiltrating lymphocyte, TIL)与更好的预后相关[34]。本研究分析了246例接受根治性放疗的ESCC患者的临床资料,结果发现,NLR、PLR和SII与肿瘤病变长度和分期有关,提示各炎性反应指标可以反映ESCC的侵袭性。与既往研究结果类似,本研究亦证实高水平PLR、NLR和SII组患者的OS和PFS明显差于低水平组。但多因素Cox回归分析显示,仅有NLR是ESCC患者OS和PFS的独立影响因素,可能是由于本研究存在一定局限性。与上述两项研究终点不同的是,本研究加入了近期疗效作为研究终点,探讨了炎性反应指标对根治性放疗的疗效预测价值,结果显示放疗前低NLR组患者可获得更好的近期疗效,而近期疗效往往与良好预后相关,提示炎性反应指标可通过影响肿瘤对放射线的敏感性来影响患者预后。NLR水平反映肿瘤介导的炎性反应和抗肿瘤免疫反应之间的平衡关系,NLR升高与T淋巴细胞活化抑制和功能障碍有关,同时肿瘤相关中性粒细胞可重塑肿瘤微环境,促进肿瘤免疫逃逸,从而影响抗肿瘤疗效[35-36]。此外,本研究ROC曲线发现,相较于PLR和SII,NLR在评估ESCC的OS和PFS中AUC值最高。这充分表明NLR对ESCC放疗疗效及预后具有较高的预测价值,优于其他炎性反应指标。
根据多因素回归分析结果,我们基于NLR和临床病理特征建立了接受根治性放疗的ESCC患者OS和PFS的列线图预测模型,C-index分别为0.703和0.668。校准曲线表明列线图模型预测患者OS、PFS与实际观察结果具有较高的一致性,表明该列线图模型有较好的预测效能,可作为临床医生准确判断患者放疗预后的定量工具。
本研究也存在一定局限性。首先,本研究为单中心回顾性研究,可能存在选择偏倚。我们只纳入了246例ESCC患者进行分析,相对较少的样本量限制了研究结果的推广。其次,本研究建立的列线图模型没有进行外部验证,后期需要进一步进行大量的外部验证以评估模型性能。因此,未来仍需要开展前瞻性、多中心、大样本研究,进一步验证本研究的结论。
综上,治疗前NLR在评估ESCC患者根治性放疗近期疗效和远期预后方面具有一定价值,纳入NLR构建的列线图模型有助于临床医生识别对放疗敏感的患者亚群,为制定精确的个体化治疗方案和判断预后提供重要参考。
Competing interests: The authors declare that they have no competing interests.利益冲突声明:所有作者均声明不存在利益冲突。作者贡献:付神波:研究设计、资料收集、统计分析、论文撰写金 龙:统计分析、论文修改梁静、郭俊俊、车宇:资料收集李晨阳:资料收集和整理陈 勇:研究设计、论文审校和修改 -
![]()
图 4 PLR(A)、NLR(B)和SII(C)对ESCC患者根治性放疗后OS的影响
Figure 4 Effect of PLR (A), NLR (B), and SII (C) on OS of esophageal squamous cell carcinoma patients after radical radiotherapy
![]()
图 5 PLR(A)、NLR(B)和SII(C)对ESCC患者根治性放疗后PFS的影响
Figure 5 Effect of PLR (A), NLR (B), and SII (C) on PFS of esophageal squamous cell carcinoma patients after radical radiotherapy
![]()
图 6 ESCC患者根治性放疗后OS(A)和PFS(B)的列线图模型
Figure 6 Nomogram models of OS (A) and PFS (B) prediction for ESCC patients after radical radiotherapy
![]()
图 7 ESCC患者根治性放疗后OS(A)和PFS(B)的校准曲线
Figure 7 Calibration curves of OS (A) and PFS (B) prediction for ESCC patients after radical radiotherapy
表 1 246例ESCC患者的临床特征
Table 1 Clinicopathological characteristics of 246 esophageal squamous cell carcinoma (ESCC) patients
Characteristics n (%) Age(years) <65 69(28.0) ≥65 177(72.0) Gender Male 166(67.5) Female 80(32.5) Length of tumor(cm) <5 122(49.6) ≥5 124(50.4) T stage T1 5(2.0) T2 38(15.4) T3 169(68.7) T4 34(13.8) N stage N0 123(50.0) N1 123(50.0) TNM stage Ⅰ 5(2.0) Ⅱ 117(47.6) Ⅲ 124(50.4) Treatment modalities CRT 66(26.8) RT 180(73.2) Notes: CRT: chemotherapy+radiotherapy; RT: radiotherapy.  下载: 导出CSV
表 2 246例ESCC患者PLR、NLR和SII与临床特征的关系(n(%))
Table 2 Correlation of PLR, NLR, and SII with clinical characteristics of 246 ESCC patients (n (%))
Characteristics PLR P NLR P SII P <146.06
(n=111)≥146.06
(n=135)<2.67
(n=125)≥2.67
(n=121)<493.97
(n=103)≥493.97
(n=143)Age(years) 0.595 0.385 0.159 <65 33(29.7) 36(26.7) 32(25.6) 37(30.6) 24(23.3) 45(31.5) ≥65 78(70.3) 99(73.3) 93(74.4) 84(69.4) 79(76.7) 98(68.5) Gender 0.805 0.011 0.019 Male 74(66.7) 92(68.1) 75(60.0) 91(75.2) 61(59.2) 105(73.4) Female 37(33.3) 43(31.9) 50(40.0) 30(24.8) 42(40.8) 38(26.6) Length of tumor(cm) 0.005 0.001 <0.001 <5 66(59.5) 56(41.5) 75(60.0) 47(38.8) 65(63.1) 57(39.9) ≥5 45(40.5) 79(58.5) 50(40.0) 74 (61.2) 38(36.9) 86(60.1) T stage 0.060 0.001 <0.001 T1 4(3.6) 1(0.7) 5(4.0) 0(0.0) 5(4.9) 0(0.0) T2 21(18.9) 17(12.6) 24(19.2) 14(11.6) 21(20.4) 17(11.9) T3 76(68.5) 93(68.9) 88(70.4) 81(66.9) 72(69.9) 97(67.8) T4 10(9.0) 24(17.8) 8(6.4) 26(21.5) 5(4.9) 29(20.3) N stage 0.370 0.030 0.053 N0 59(53.2) 64(47.4) 71(56.8) 52(43.0) 59(57.3) 64(44.8) N1 52(46.8) 71(52.6) 54(43.2) 69(57.0) 44(42.7) 79(55.2) TNM stage 0.121 <0.001 0.001 Ⅰ 4(3.6) 1(0.7) 5(4.0) 0(0.0) 5(4.9) 0(0.0) Ⅱ 57(51.4) 60(44.4) 71(56.8) 46(38.0) 57(55.3) 60(42.0) Ⅲ 50(45.0) 74(54.8) 49(39.2) 75(62.0) 41(39.8) 83(58.0) Treatment modalities 0.521 0.199 0.490 CRT 32(28.8) 34(25.2) 38(30.4) 28(23.1) 30(29.1) 36(25.2) RT 79(71.2) 101(74.8) 87(69.6) 93(76.9) 73(70.9) 107(47.8)
下载: 导出CSV
表 3 ESCC患者根治性放疗后OS的单因素和多因素分析
Table 3 Univariate and multivariate analyses for OS of ESCC patients after radical radiotherapy
Characteristics Univariate analysis Multivariate analysis HR (95%CI) P HR (95%CI) P Age 1.332 (0.948–1.870) 0.098 Gender 0.535 (0.383–0.747) <0.001 0.608 (0.429–0.863) 0.005 Length of tumor 1.374 (1.026–1.841) 0.033 0.993 (0.729–1.352) 0.963 T stage 1.988 (1.530–2.582) <0.001 1.875 (1.353–2.596) <0.001 N stage 1.294 (0.967–1.732) 0.083 TNM stage 1.742 (1.321–2.297) <0.001 0.938 (0.658–1.338) 0.725 Treatment modalities 0.653 (0.466–0.915) 0.013 0.591 (0.417–0.836) 0.003 PLR 1.613 (1.198–2.172) 0.002 0.987 (0.669–1.455) 0.947 NLR 2.382 (1.768–3.209) <0.001 1.615 (1.034–2.524) 0.035 SII 2.251 (1.650–3.069) <0.001 1.274 (0.775–2.095) 0.340
下载: 导出CSV
表 4 ESCC患者根治性放疗后PFS的单因素和多因素分析
Table 4 Univariate and multivariate analyses for PFS of ESCC patients after radical radiotherapy
Characteristics Univariate analysis Multivariate analysis HR (95%CI) P HR (95%CI) P Age 1.135 (0.818–1.574) 0.449 Gender 0.634 (0.459–0.875) 0.006 0.794 (0.564–1.118) 0.186 Length of tumor 1.385 (1.035–1.854) 0.028 1.050 (0.775–1.423) 0.751 T stage 1.902 (1.471–2.460) <0.001 1.668 (1.214–2.290) 0.002 N stage 1.265 (0.946–1.691) 0.113 TNM stage 1.649 (1.255–2.167) <0.001 0.951 (0.668–1.354) 0.779 Treatment modalities 0.818 (0.591–1.133) 0.227 PLR 1.721 (1.279–2.315) <0.001 0.984 (0.668–1.450) 0.934 NLR 2.539 (1.883–3.423) <0.001 1.727 (1.101–2.709) 0.017 SII 2.425 (1.778–3.308) <0.001 1.384 (0.839–2.282) 0.203
下载: 导出CSV
-
[1] Bray F, Laversanne M, Sung H, et al. Global cancer statistics 2022: Globocan estimates of incidence and mortality worldwide for 36 cancers in 185 countries[J]. CA Cancer J Clin, 2024, 74(3): 229-263. doi: 10.3322/caac.21834
[2] 郑荣寿, 陈茹, 韩冰峰, 等. 2022年中国恶性肿瘤流行情况分析[J]. 中华肿瘤杂志, 2024, 46(3): 221-231. [Zheng RS, Chen R, Han BF, et al. Cancer incidence and mortality in China, 2022][J]. Zhonghua Zhong Liu Za Zhi, 2024, 46(3): 221-231.] Zheng RS, Chen R, Han BF, et al. Cancer incidence and mortality in China, 2022][J]. Zhonghua Zhong Liu Za Zhi, 2024, 46(3): 221-231.
[3] He F, Wang J, Liu L, et al. Esophageal cancer: Trends in incidence and mortality in china from 2005 to 2015[J]. Cancer Medicine, 2021, 10(5): 1839-1847. doi: 10.1002/cam4.3647
[4] Cooper JS, Guo MD, Herskovic A, et al. Chemoradiotherapy of locally advanced esophageal cancerlong-term follow-up of a prospective randomized trial (rtog 85-01)[J]. JAMA, 1999, 281(17): 1623-1627.
[5] Minsky BD, Pajak TF, Ginsberg RJ, et al. Int 0123 (radiation therapy oncology group 94-05) phase iii trial of combined-modality therapy for esophageal cancer: High-dose versus standard-dose radiation therapy[J]. J Clin Oncol, 2002, 20(5): 1167-1174. doi: 10.1200/JCO.2002.20.5.1167
[6] Hulshof M, Geijsen ED, Rozema T, et al. Randomized study on dose escalation in definitive chemoradiation for patients with locally advanced esophageal cancer (artdeco study)[J]. J Clin Oncol, 2021, 39(25): 2816-2824. doi: 10.1200/JCO.20.03697
[7] Kim E, Koroukian S, Thomas CR Jr. Conditional survival of esophageal cancer: An analysis from the seer registry (1988-2011)[J]. J Thorac Oncol, 2015, 10(10): 1490-1497. doi: 10.1097/JTO.0000000000000649
[8] Wei WQ, Chen ZF, He YT, et al. Long-term follow-up of a community assignment, one-time endoscopic screening study of esophageal cancer in China[J]. J Clin Oncol, 2015, 33(17): 1951-1957. doi: 10.1200/JCO.2014.58.0423
[9] Greten FR, Grivennikov SI. Inflammation and cancer: Triggers, mechanisms, and consequences[J]. Immunity, 2019, 51(1): 27-41. doi: 10.1016/j.immuni.2019.06.025
[10] Hanahan D, Weinberg RA. Hallmarks of cancer: The next generation[J]. Cell, 2011, 144(5): 646-674. doi: 10.1016/j.cell.2011.02.013
[11] He K, Si L, Pan X, et al. Preoperative systemic immune-inflammation index (sii) as a superior predictor of long-term survival outcome in patients with stage i-ii gastric cancer after radical surgery[J]. Front Oncol, 2022, 12: 829689. doi: 10.3389/fonc.2022.829689
[12] Cupp MA, Cariolou M, Tzoulaki I, et al. Neutrophil to lymphocyte ratio and cancer prognosis: An umbrella review of systematic reviews and meta-analyses of observational studies[J]. BMC Medicine, 2020, 18(1): 360. doi: 10.1186/s12916-020-01817-1
[13] Yuan Q, Xu C, Wang W, et al. Predictive value of nlr and plr in driver-gene-negative advanced non-small cell lung cancer treated with pd-1/pd-l1 inhibitors: A single institutional cohort study [J]. Technol Cancer Res Treat, 2024, 23: 15330338241246651.
[14] Asaka S, Shimakawa T, Nishiguchi R, et al. Preoperative and postoperative c-reactive protein to albumin ratio (car) as a prognostic marker for survival of esophageal squamous cell carcinoma patients after surgery[J]. Anticancer Res, 2023, 43(11): 5139-5147. doi: 10.21873/anticanres.16714
[15] Nost TH, Alcala K, Urbarova I, et al. Systemic inflammation markers and cancer incidence in the uk biobank[J]. Eur J Epidemiol, 2021, 36(8): 841-848. doi: 10.1007/s10654-021-00752-6
[16] Faria SS, Giannarelli D, Cordeiro De Lima VC, et al. Development of a prognostic model for early breast cancer integrating neutrophil to lymphocyte ratio and clinical-pathological characteristics[J]. Oncologist, 2024, 29(4): e447-e454. doi: 10.1093/oncolo/oyad303
[17] Dong Q, Zhao F, Li Y, et al. The correlation between systemic inflammatory markers and efficiency for advanced gastric cancer patients treated with icis combined with chemotherapy[J]. Immunology, 2024, 172(1): 77-90. doi: 10.1111/imm.13759
[18] Li C, Wu J, Jiang L, et al. The predictive value of inflammatory biomarkers for major pathological response in non-small cell lung cancer patients receiving neoadjuvant chemoimmunotherapy and its association with the immune-related tumor microenvironment: A multi-center study[J]. Cancer Immunol Immunother, 2023, 72(3): 783-794. doi: 10.1007/s00262-022-03262-w
[19] Aoyama T, Kazama K, Maezawa Y, et al. Usefulness of nutrition and inflammation assessment tools in esophageal cancer treatment[J]. In Vivo, 2023, 37(1): 22-35. doi: 10.21873/invivo.13051
[20] Shaul ME, Fridlender ZG. Tumour-associated neutrophils in patients with cancer[J]. Nat Rev Clin Oncol, 2019, 16(10): 601-620. doi: 10.1038/s41571-019-0222-4
[21] Hedrick CC, Malanchi I. Neutrophils in cancer: Heterogeneous and multifaceted[J]. Nat Rev Immunol, 2022, 22(3): 173-187. doi: 10.1038/s41577-021-00571-6
[22] Wculek SK, Bridgeman VL, Peakman F, et al. Early neutrophil responses to chemical carcinogenesis shape long-term lung cancer susceptibility[J]. iScience, 2020, 23(7): 101277. doi: 10.1016/j.isci.2020.101277
[23] Li P, Lu M, Shi J, et al. Dual roles of neutrophils in metastatic colonization are governed by the host nk cell status[J]. Nat Commun, 2020, 11(1): 4387. doi: 10.1038/s41467-020-18125-0
[24] Strobech JE, Giuriatti P, Erler JT. Neutrophil granulocytes influence on extracellular matrix in cancer progression[J]. Am J Physiol Cell Physiol, 2022, 323(2): C486-C493. doi: 10.1152/ajpcell.00122.2022
[25] Giannakeas V, Narod SA. Incidence of cancer among adults with thrombocytosis in Ontario, Canada[J]. JAMA Netw Open, 2021, 4(8): e2120633. doi: 10.1001/jamanetworkopen.2021.20633
[26] Li M, Zhao S, Lopez G, et al. Mean platelet volume, thrombocytosis, and survival in non-small cell lung cancer patients treated with first-line pembrolizumab alone or with chemotherapy[J]. Cancer Immunol Immunother, 2023, 72(7): 2067-2074. doi: 10.1007/s00262-023-03392-9
[27] Rothwell PM, Wilson M, Price JF, et al. Effect of daily aspirin on risk of cancer metastasis: A study of incident cancers during randomised controlled trials[J]. Lancet, 2012, 379(9826): 1591-1601. doi: 10.1016/S0140-6736(12)60209-8
[28] Tao DL, Tassi Yunga S, Williams CD, et al. Aspirin and antiplatelet treatments in cancer[J]. Blood, 2021, 137(23): 3201-3211. doi: 10.1182/blood.2019003977
[29] Wu Y, Yuan M, Wang C, et al. T lymphocyte cell: A pivotal player in lung cancer[J]. Front Immunol, 2023, 14: 1102778. doi: 10.3389/fimmu.2023.1102778
[30] Zhang X, Jing J. Effect of peripheral blood lymphocytes on prognosis of multiple cancers[J]. Cancer Control, 2023, 30: 10732748231202921.
[31] Pirozzolo G, Gisbertz SS, Castoro C, et al. Neutrophil-to-lymphocyte ratio as prognostic marker in esophageal cancer: A systematic review and meta-analysis[J]. J Thorac Dis, 2019, 11(7): 3136-3145. doi: 10.21037/jtd.2019.07.30
[32] Cai G, Yu J, Meng X. Predicting prognosis and adverse events by hematologic markers in patients with locally advanced esophageal squamous cell carcinoma treated with neoadjuvant chemoradiotherapy[J]. Cancer Manag Res, 2020, 12: 8497-8507. doi: 10.2147/CMAR.S257058
[33] Wu YF, Chu SC, Chang BS, et al. Hematologic markers as prognostic factors in nonmetastatic esophageal cancer patients under concurrent chemoradiotherapy[J]. Biomed Res Int, 2019, 2019: 1263050.
[34] Yang J, Zheng J, Qiu J, et al. Systemic immune-inflammatory index, tumor-infiltrating lymphocytes, and clinical outcomes in esophageal squamous cell carcinoma receiving concurrent chemoradiotherapy[J]. J Immunol Res, 2023, 2023: 4275998.
[35] Schalper KA, Carleton M, Zhou M, et al. Elevated serum interleukin-8 is associated with enhanced intratumor neutrophils and reduced clinical benefit of immune-checkpoint inhibitors[J]. Nat Med, 2020, 26(5): 688-692. doi: 10.1038/s41591-020-0856-x
[36] Hwang M, Canzoniero JV, Rosner S, et al. Peripheral blood immune cell dynamics reflect antitumor immune responses and predict clinical response to immunotherapy[J]. J Immunother Cancer, 2022, 10(6): e004688. doi: 10.1136/jitc-2022-004688


计量
- 文章访问数: 311
- HTML全文浏览量: 143
- PDF下载量: 48

